特卡罗方法方法介绍
一、概述
蒙特卡罗方法是一种计算方法。原理是通过大量随机样本,测试各种可能结果,去了解一个系统,进而得到所要计算的值。
它非常强大和灵活,又相当简单易懂,很容易实现。对于许多问题来说,它往往是最简单的计算方法,有时甚至是唯一可行的方法。
它诞生于上个世纪40年代美国的”曼哈顿计划”,名字来源于赌城蒙特卡罗,象征概率。
二、π的计算
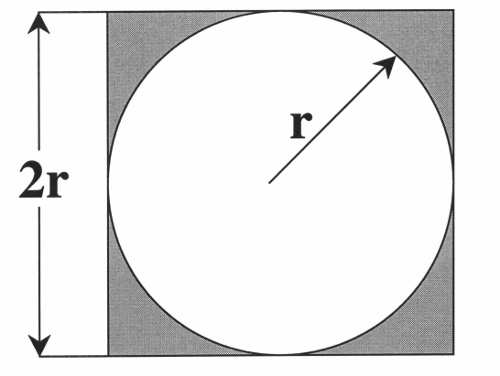
第一个例子是,如何用蒙特卡罗方法计算圆周率π。
正方形内部有一个相切的圆,它们的面积之比是π/4。
![]()
现在,在这个正方形内部,随机产生10000个点(即10000个坐标对 (x, y)),计算它们与中心点的距离,从而判断是否落在圆的内部。
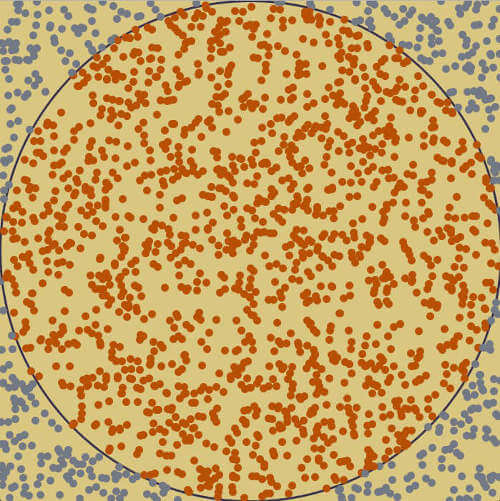
如果这些点均匀分布,那么圆内的点应该占到所有点的 π/4,因此将这个比值乘以4,就是π的值。


import random
n = 10000
k = 0
for i in range(n):
    x = random.uniform(-1,1)
    y = random.uniform(-1,1)
    if x**2 + y**2 <1:
        k += 1
print(4*float(k)/float(n))
三、积分的计算
上面的方法加以推广,就可以计算任意一个积分的值。
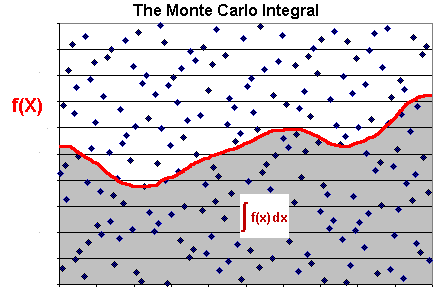
比如,计算函数 y = x2 在 [0, 1] 区间的积分,就是求出下图红色部分的面积。
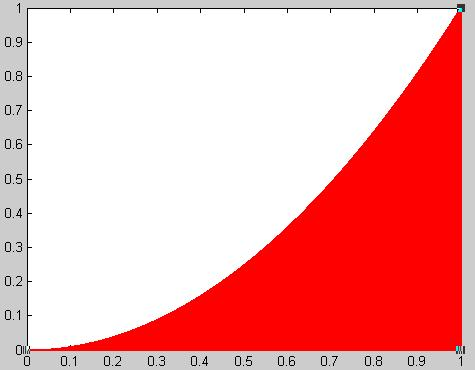
这个函数在 (1,1) 点的取值为1,所以整个红色区域在一个面积为1的正方形里面。在该正方形内部,产生大量随机点,可以计算出有多少点落在红色区域(判断条件 y < x2)。这个比重就是所要求的积分值。
import random

n = 10000
k = 0

for i in range(n):
    x = random.uniform(0,1)
    y = random.uniform(0,1)
    if x**2 > y:
        k += 1

print(float(k)/float(n))
四、交通堵塞
蒙特卡罗方法不仅可以用于计算,还可以用于模拟系统内部的随机运动。下面的例子模拟单车道的交通堵塞。
根据 Nagel-Schreckenberg 模型,车辆的运动满足以下规则。
- 当前速度是 v 。
- 如果前面没车,它在下一秒的速度会提高到 v + 1 ,直到达到规定的最高限速。
- 如果前面有车,距离为d,且 d < v,那么它在下一秒的速度会降低到 d – 1 。
- 此外,司机还会以概率 p 随机减速, 将下一秒的速度降低到 v – 1 。
在一条直线上,随机产生100个点,代表道路上的100辆车,另取概率 p 为 0.3 。

上图中,横轴代表距离(从左到右),纵轴代表时间(从上到下),因此每一行就表示下一秒的道路情况。
可以看到,该模型会随机产生交通拥堵(图形上黑色聚集的部分)。这就证明了,单车道即使没有任何原因,也会产生交通堵塞。
五、产品厚度
某产品由八个零件堆叠组成。也就是说,这八个零件的厚度总和,等于该产品的厚度。
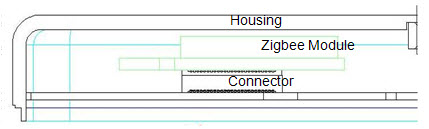
已知该产品的厚度,必须控制在27mm以内,但是每个零件有一定的概率,厚度会超出误差。请问有多大的概率,产品的厚度会超出27mm?
取100000个随机样本,每个样本有8个值,对应8个零件各自的厚度。计算发现,产品的合格率为99.9979%,即百万分之21的概率,厚度会超出27mm。
六、证券市场
证券市场有时交易活跃,有时交易冷清。下面是你对市场的预测。
- 如果交易冷清,你会以平均价11元,卖出5万股。
- 如果交易活跃,你会以平均价8元,卖出10万股。
- 如果交易温和,你会以平均价10元,卖出7.5万股。
已知你的成本在每股5.5元到7.5元之间,平均是6.5元。请问接下来的交易,你的净利润会是多少?
取1000个随机样本,每个样本有两个数值:一个是证券的成本(5.5元到7.5元之间的均匀分布),另一个是当前市场状态(冷清、活跃、温和,各有三分之一可能)。

模拟计算得到,平均净利润为92, 427美元。
Monte Carlo Introduction
Welcome to the monte carlo simulation experiment with python.
Before we begin, we should establish what a monte carlo simulation is. The idea of a monte carlo simulation is to test various outcome possibilities. In reality, only one of the outcome possibilities will play out, but, in terms of risk assessment, any of the possibilities could have occurred.
Monte carlo simulators are often used to assess the risk of a given trading strategy say with options or stocks.
Monte carlo simulators can help drive the point home that success and outcome is not the only measure of whether or not a choice was good or not. Choices should not be assesed after their outcome. Instead, the risks and benefits should only be considered at the time the decision was made, without hindsight bias. A monte carlo simulator can help one visualize most or all of the potential outcomes to have a much better idea regarding the risk of a decision.
With that, let's consider a basic example. Here, we will consider a gambling scenario, where a user can "roll" the metaphorical dice for an outcome of 1 to 100.
If the user rolls anything from 1-50, the "house" wins. If the user rolls anything from 51 to 99, the "user" wins. If the user rolls a 100, they lose.
With this, the house maintains a mere 1% edge, which is much smaller than the typical house edge, as well as the market edge when incorporating trading costs.
For example, consider if you are trading with Scottrade, where the house takes $7 a trade. If you invest $1,000 per stock, this means you have $7 to pay in entry, and $7 to pay in exit, for a total of $14.
This puts the "house edge" to 1.4% right out of the gate. Notably, Scottrade is not the actual house. The house is just not you. This means that, on a long term scale, your bets need to do better than 1.4% profit on average, otherwise you will be losing money. Despite the small number, the odds are already against you. Trading is a 50/50 game, especially in the short term.
A monte carlo generator can also help illustrate the flaws of the gambler's fallacy. Many gamblers, and sometimes especially gamblers who understand statistics, fall prey to the gambler's fallacy.
The fallacy asserts that, taking something like the flipping of a coin for heads or tails, you have a known 50/50 odds. That said, if you just flipped heads five times a row, somehow you're more likely to flip tails next.
No matter how many heads have preceeded, your odds, each time you flip the coin are 50/50. It is easy to fall into the trap of thinking that on a long term scale odds will correlate to 50/50 therefor if the odds are imbalanced currently then the next flip's odds are also not 50/50
So again, with our example in mind, 1-50, house wins. 51-99 user wins. A perfect 100 means house wins.
Now, let's begin. We first need to create our dice. For this, we'll employ the pseudo random number generator in python.
import random

def rollDice():
    roll = random.randint(1,100)
    return roll

# Now, just to test our dice, let's roll the dice 100 times.

x = 0
while x < 100:
    result = rollDice()
    print(result)
    x+=1
Monte Carlo dice Function
Alright, so our dice works!
Now we need to create a bettor. Eventually, we'll create some more sophisticated bettors, but we'll start extremely basic for now, as even the simplist bettor will actually show us some fascinating things when it comes to chance and possibility, using a monte carlo generator.
import random

# let us go ahead and change this to return a simple win/loss

def rollDice():
    roll = random.randint(1,100)

    if roll == 100:
        print (roll,'roll was 100, you lose. What are the odds?! Play again!')
        return False
    elif roll <= 50:
        print (roll,'roll was 1-50, you lose.')
        return False
    elif 100 > roll >= 50:
        print (roll,'roll was 51-99, you win! *pretty lights flash* (play more!)')
        return True


'''
Simple bettor, betting the same amount each time.
'''

def simple_bettor(funds,initial_wager,wager_count):
    value = funds
    wager = initial_wager

    currentWager = 0

    while currentWager < wager_count:
        if rollDice():
            value += wager
        else:
            value -= wager

        currentWager += 1
        print ('Funds:', value)


simple_bettor(10000,100,100)
Creating a simple Bettor
'''
so now we've got a bettor, he's working, and we've seen some basic outcomes
but now we want to see some longer-term outcomes, so first let's do that.
'''

import random

# let us go ahead and change this to return a simple win/loss

def rollDice():
    roll = random.randint(1,100)

    if roll == 100:
        print (roll,'roll was 100, you lose. What are the odds?! Play again!')
        return False
    elif roll <= 50:
        print (roll,'roll was 1-50, you lose.')
        return False
    elif 100 > roll >= 50:
        print (roll,'roll was 51-99, you win! *pretty lights flash* (play more!)')
        return True


'''
Simple bettor, betting the same amount each time.
'''

def simple_bettor(funds,initial_wager,wager_count):
    value = funds
    wager = initial_wager

    currentWager = 0

    while currentWager < wager_count:
        if rollDice():
            value += wager
        else:
            value -= wager

        currentWager += 1

    # changed to reduce spam
    if value < 0:
        value = 'Broke!'
    print ('Funds:', value)

# lots of wagers now....
x = 0

while x < 100:
    simple_bettor(10000,100,50)
    x += 1
Interestingly enough, you can see there is quite the spread here.
Keep in mind, the odds are only 1% against you.
Now we can see most people have gone broke, all but 1 person is either broke or a loser. Interestingly sometimes you find people actually make large profits.
This visualization, however, is sub par. let's add to this, shall we?
Plotting Results with Matpltolib
Monte carlo results from betting
we're going to use matplotlib to further visualize our gamblers and their varying scenarios.
This will be especially useful for when we begin adding different bettor types. So far, we've only been able to see the a single person's various odds examples, nothing more.
Interestingly enough, at this point, should a bettor make their way to doubling their money, they might be thought of as having an expert strategy.
We know this is not true, but the same can be said for stock traders.
Most stock traders are graded on their performance, not by the weight of their risk. We can clearly see already, however, that, statistically, there must be some traders who heavily outperform. Just by sheer odds they must exist, but these people can blow up just as quickly, or usually faster, than they grew. Anyway, let's start up the graphing!
import random
import matplotlib
import matplotlib.pyplot as plt

def rollDice():
    roll = random.randint(1, 100)

    if roll == 100:
        return False
    elif roll <= 50:
        return False
    elif 100 > roll >= 50:
        return True

'''
Simple bettor, betting the same amount each time.
'''

def simple_bettor(funds, initial_wager, wager_count):
    value = funds
    wager = initial_wager
    # wager X
    wX = []
    # value Y
    vY = []
    # change to 1, to avoid confusion so we start @ wager 1
    # instead of wager 0 and end at 100.
    currentWager = 1

    #  change this to, less or equal.
    while currentWager <= wager_count:
        if rollDice():
            value += wager
            # append #
            wX.append(currentWager)
            vY.append(value)
        else:
            value -= wager
            # append #
            wX.append(currentWager)
            vY.append(value)
        currentWager += 1
    # print 'Funds:', value
    plt.plot(wX, vY)

x = 0

# start this off @ 1, then add, and increase 50 to 500, then 1000
while x < 100:
    simple_bettor(10000, 100, 1000)
    x += 1

plt.ylabel('Account Value')
plt.xlabel('Wager Count')
plt.show()
At only 100 bets, it is clear that there is some edge, but it looks like a lot of people are getting lucky. It is only money, let's play!
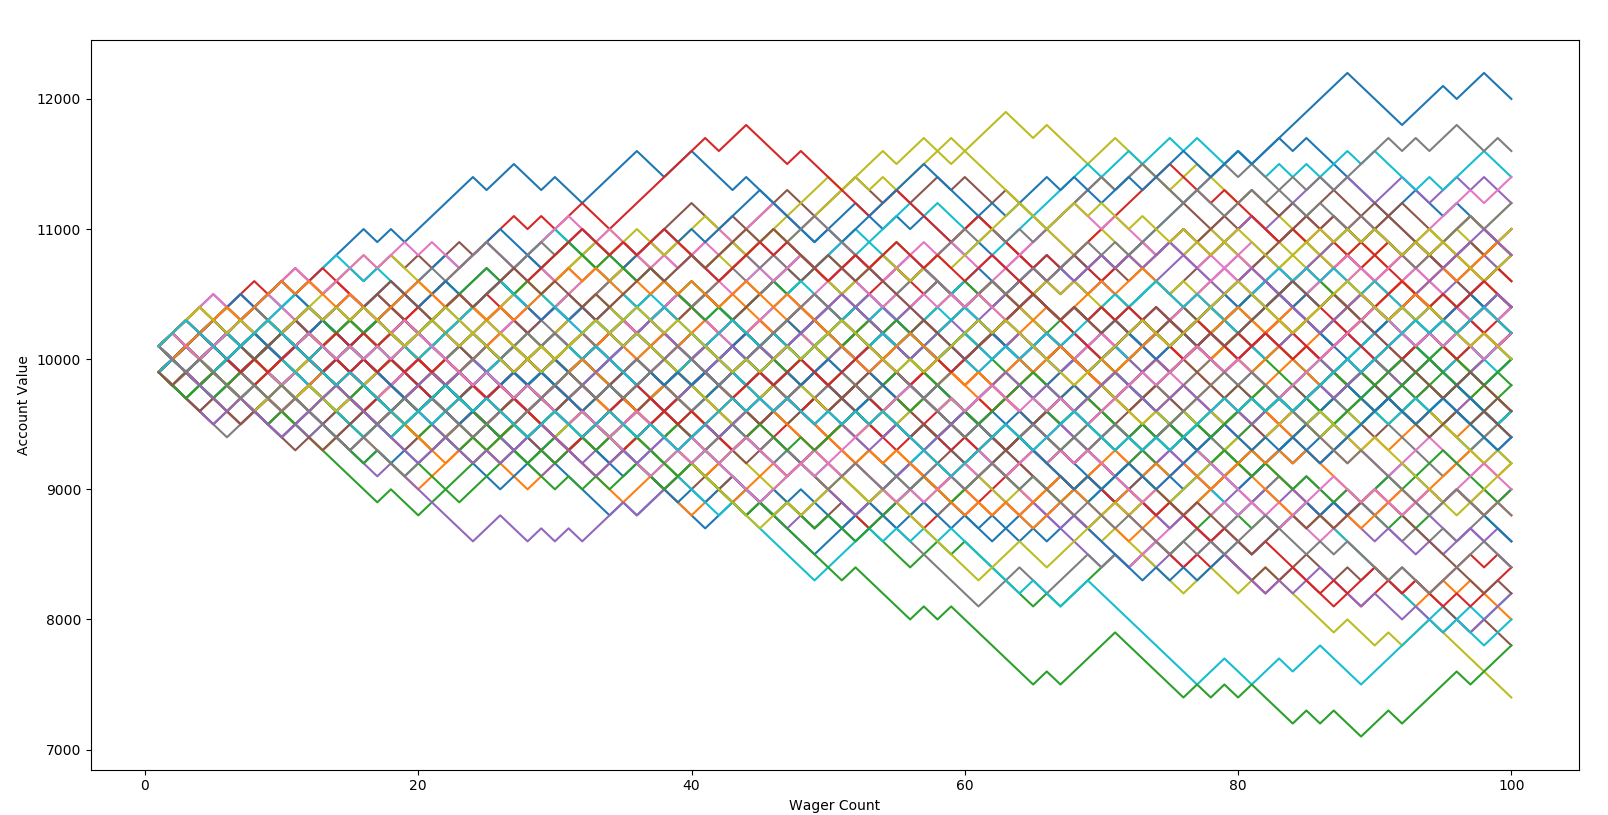
Even at 1,000 bets, some people are making a lot of money!
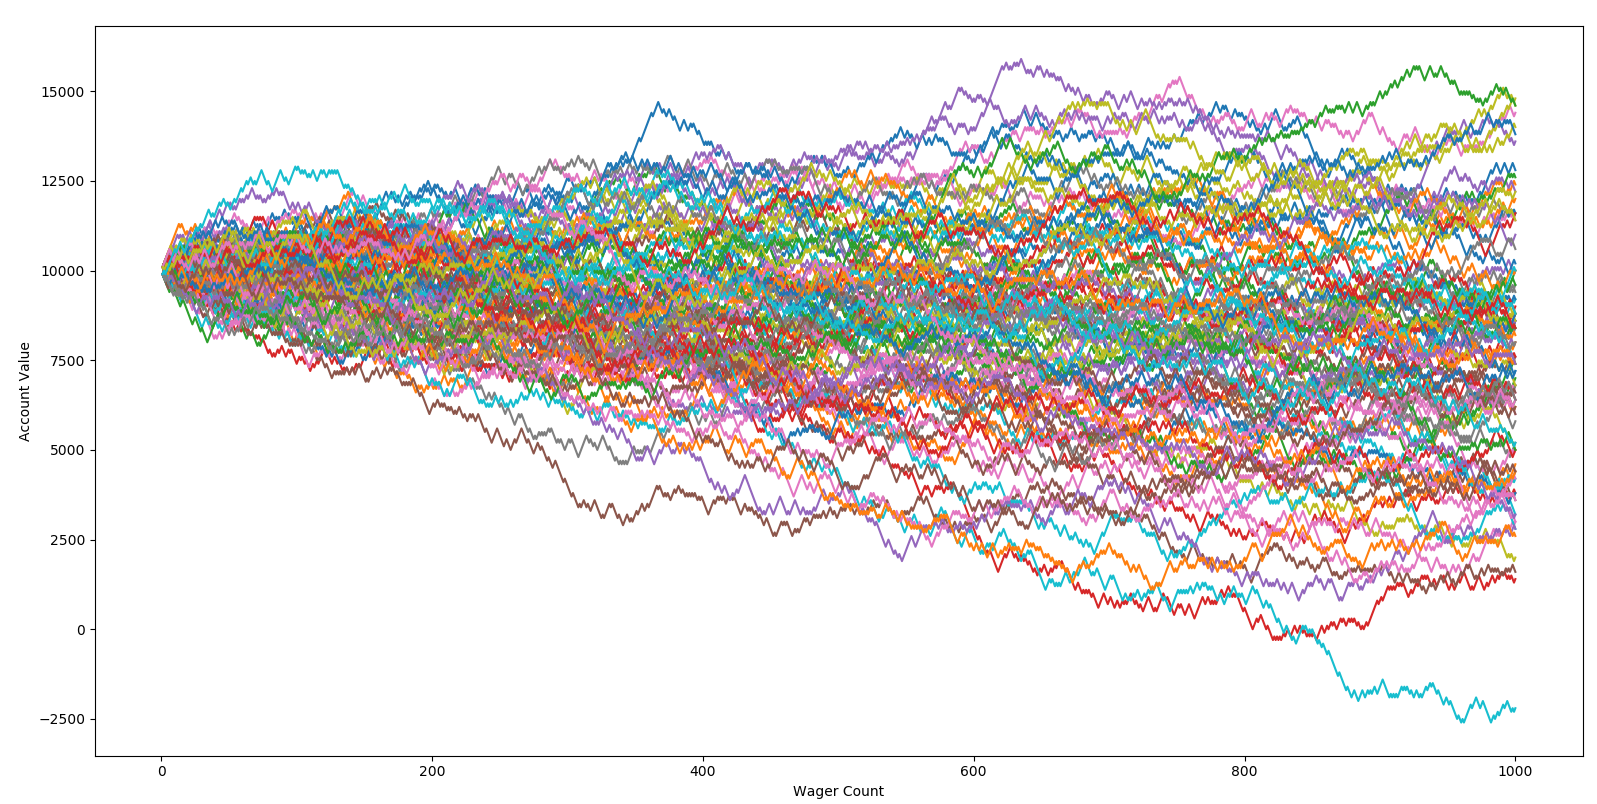
but at 100,000 it's extremely obvious. In my example, ALL of bettors are in heavy debt.

This is why gamblers lose. Usually the odds are not extremely heavily stacked against them, just slightly. Casinos just understand basic psychology, knowing that "winning" is extremely addicting. Casinos are built to keep you in, and keep you playing.
In the short term, most players do not really realize that they are so certain to lose, the wins and losses seem pretty even. Some people, almost half, are statistically certain to actually profit. The problem is this is addicting, and they want to continue doing it. They end up continuing, and most end up handing back their gains. It's just simple math, but human psychology is weak.
At this point, bettors, with their bettor mind, begin to envision various strategies to overtake their odds.
One of the most common practices here is doubling up on losses. So, if you lose, you just double your wager until you win. After you've won, you revert back to your starting point. We just need that 1% edge, it should be super easy right?
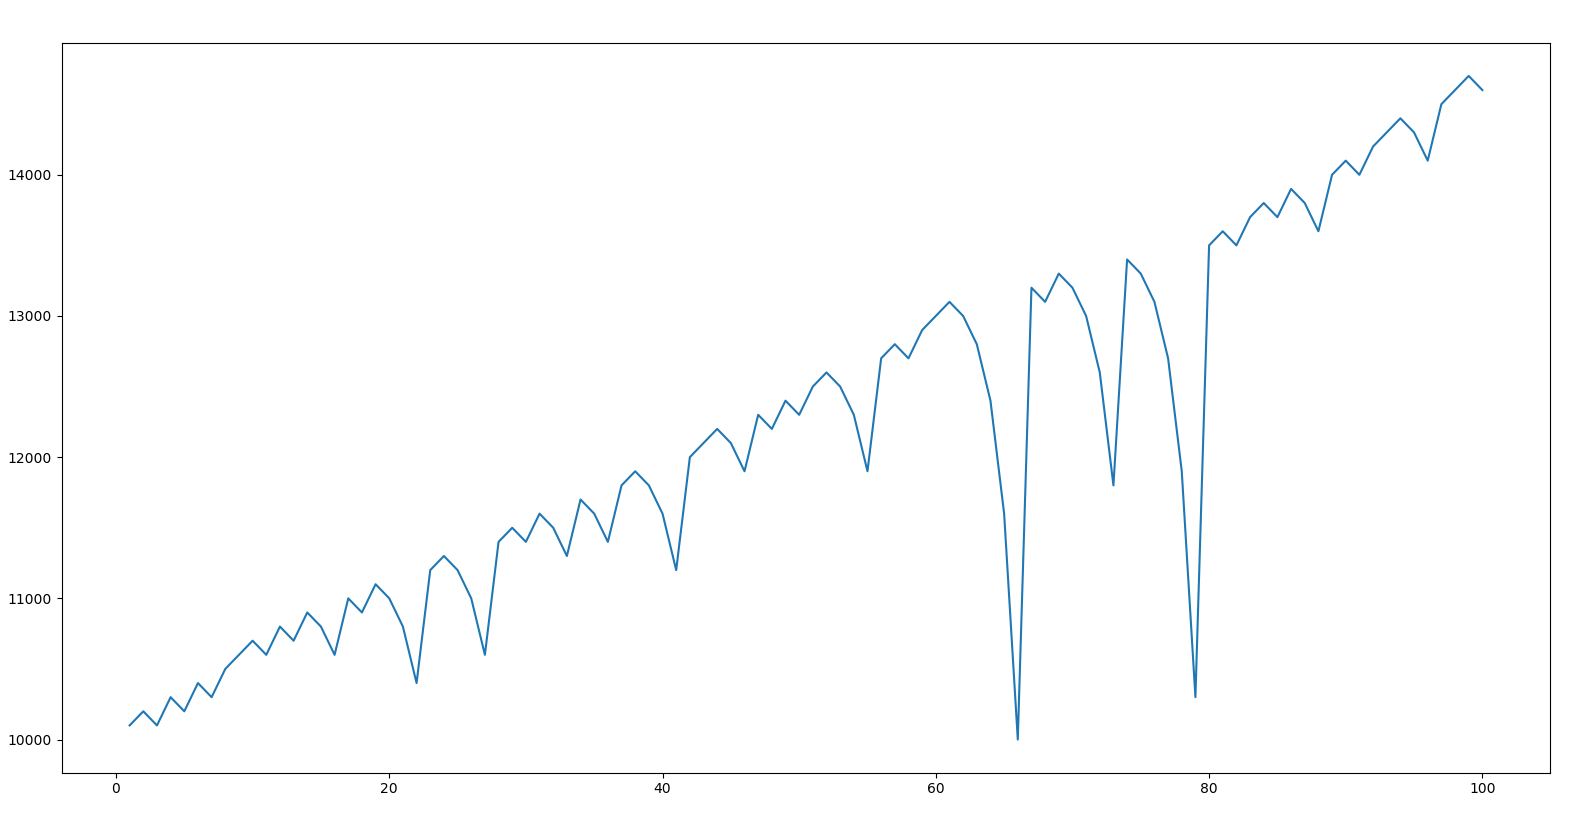
Martingale Strategy
One of the most common bright ideas people get is to double up on losses. Thus, if you lose, you just simply double the previous wager amount. You continue this until a win.
If you have unlimited money, this strategy works, but you don't, so it doesn't. All this strategy does is accelerates the process. Again, each time you wager, you face whatever the odds are. You cannot avoid them. Regardless, we're going to illustrate it!
import random
import matplotlib
import matplotlib.pyplot as plt
import time

def rollDice():
    roll = random.randint(1, 100)

    if roll == 100:
        return False
    elif roll <= 50:
        return False
    elif 100 > roll >= 50:
        return True

def doubler_bettor(funds, initial_wager, wager_count):
    value = funds
    wager = initial_wager
    wX = []
    vY = []
    currentWager = 1

    # since we'll be betting based on previous bet outcome #
    previousWager = 'win'

    # since we'll be doubling #
    previousWagerAmount = initial_wager

    while currentWager <= wager_count:
        if previousWager == 'win':
            print( 'we won the last wager, yay!')
            if rollDice():
                value += wager
                print (value)
                wX.append(currentWager)
                vY.append(value)
            else:
                value -= wager
                previousWager = 'loss'
                print(value)
                previousWagerAmount = wager
                wX.append(currentWager)
                vY.append(value)
                if value < 0:
                    print('went broke after', currentWager, 'bets')
                    currentWager += 10000000000000000
        elif previousWager == 'loss':
            print('we lost the last one, so we will be super smart & double up!')
            if rollDice():
                wager = previousWagerAmount * 2
                print ('we won', wager)
                value += wager
                print(value)
                wager = initial_wager
                previousWager = 'win'
                wX.append(currentWager)
                vY.append(value)
            else:
                wager = previousWagerAmount * 2
                print('we lost', wager)
                value -= wager
                if value < 0:
                    print('went broke after', currentWager, 'bets')
                    currentWager += 10000000000000000
                print(value)
                previousWager = 'loss'
                previousWagerAmount = wager
                wX.append(currentWager)
                vY.append(value)
                if value < 0:
                    print('went broke after', currentWager, 'bets')
                    currentWager += 10000000000000000

        currentWager += 1

    print(value)
    plt.plot(wX, vY)

doubler_bettor(10000, 100, 100)
plt.show()
time.sleep(555)

'''
Simple bettor, betting the same amount each time.
'''

def simple_bettor(funds, initial_wager, wager_count):
    value = funds
    wager = initial_wager
    wX = []
    vY = []
    currentWager = 1
    while currentWager <= wager_count:
        if rollDice():
            value += wager
            wX.append(currentWager)
            vY.append(value)
        else:
            value -= wager
            wX.append(currentWager)
            vY.append(value)
        currentWager += 1
    plt.plot(wX, vY)


x = 0

while x < 100000:
    simple_bettor(10000, 100, 1000)
    x += 1

plt.ylabel('Account Value')
plt.xlabel('Wager Count')
plt.show()