想要完成上面的功能需要修改的文件比较多,图标自己到iconfont网站上面自己下载。为了不影响别的图标,自己在app/assets/目录下面新建一个目录,下载好的字体放进去
在/app/app.tsx文件中全局引入
import 'assets/BIfonts/iconfont.css'
然后要改动的主要就是containers/Widget目录下面的文件
conponents/Chart/Chrats.tsx文件中头部引入echarts-liquidfill
import 'echarts-liquidfill'
conponents/Chart/Widget/index.tsx文件中
export interface IChartStyles {
...
//TODO 该文件暂时可以不改不影响图表展示
//progress?: IGaugeConfig
}
conponents/Chart/Workbench/OperatingPanel.tsx文件中
const {
  ...
   doubleYAxis,

  progress,
  liquidfill

} = styleParams

{gauge && (
  <GaugeSection
    title="仪表盘"
    config={gauge}
    onChange={this.styleChange('gauge')}
  />
)}代码后面添加下面代码

{progress && (
  <GaugeSection
    title="进度条"
    config={progress}
    onChange={this.styleChange('progress')}
  />
)}
{liquidfill && (
  <GaugeSection
    title="水滴图"
    config={liquidfill}
    onChange={this.styleChange('liquidfill')}
  />
)}
//GaugeSection组件后期需要替换掉,暂时不影响 在conponents/Chart/Workbench/ConfigSections文件夹下面创建需要的水滴图与进度条Setion页面可以参照GaugeSetion.tsx
修改 conponents/Chart/config/chart目录下面的ChartTypes.ts 在enum中添加下面代码
/**
   * 进度条 jeiiy
   */
  Progress = 18,
/**
 * 进度条 jeiiy
 */
  Liquidfill = 19
修改 conponents/Chart/config/chart目录下面的index.tsx
import progress from './progress'
import liquidfill from './liquidfill'

const widgetlibs: IChartInfo[] = [
  ...
  progress,
  liquidfill
]
在 conponents/Chart/config/chart 目录下添加liquidfill.ts
//jeiiy
import ChartTypes from './ChartTypes'
import echarts from 'echarts'
import {
  PIVOT_CHART_FONT_FAMILIES,
  PIVOT_DEFAULT_FONT_COLOR,
  PIVOT_DEFAULT_AXIS_LINE_COLOR,
  CHART_FUNNEL_LABEL_POSITIONS,
  CHART_SORT_MODES,
  CHART_ALIGNMENT_MODES,
  DEFAULT_FONT_STYLE,
  DEFAULT_ECHARTS_THEME
} from 'app/globalConstants'

import { IChartInfo } from 'containers/Widget/components/Widget'

const liquidfill: IChartInfo = {
  id: ChartTypes.Liquidfill,
  name: 'liquidfill',
  title: '水波图',
  icon: 'icon-chart-liquidfill',
  coordinate: 'cartesian',
  rules: [{ dimension: 1, metric: [1, 9999] }],
  dimetionAxis: 'col',
  data: {
    cols: {
      title: '列',
      type: 'category'
    },
    rows: {
      title: '行',
      type: 'category'
    },
    metrics: {
      title: '指标',
      type: 'value'
    },
    filters: {
      title: '筛选',
      type: 'all'
    },
    color: {
      title: '颜色',
      type: 'category'
    },
    tip: {
      title: '提示信息',
      type: 'value'
    }
  },
  style: {
    liquidfill: {
      radius: 75,
      splitNumber: 10,
      startAngle: 225,
      endAngle: -45,
      clockwise: true,
      max: 100,
      prefix: '',
      suffix: '%',
      showTitle: true,
      titleFontFamily: PIVOT_CHART_FONT_FAMILIES[0].value,
      titleFontSize: '16',
      titleColor: PIVOT_DEFAULT_FONT_COLOR,
      titleOffsetLeft: 0,
      titleOffsetTop: -40,
      showDetail: true,
      detailFontFamily: PIVOT_CHART_FONT_FAMILIES[0].value,
      detailFontSize: '28',
      detailColor: PIVOT_DEFAULT_FONT_COLOR,
      detailOffsetLeft: 0,
      detailOffsetTop: 40,
      showPointer: true,
      pointerLength: 80,
      pointerWidth: 8,
      customPointerColor: false,
      pointerColor: DEFAULT_ECHARTS_THEME.color[0],
      pointerBorderStyle: 'solid',
      pointerBorderWidth: 0,
      pointerBorderColor: PIVOT_DEFAULT_AXIS_LINE_COLOR,
      axisLineSize: 30,
      axisLineColor: DEFAULT_ECHARTS_THEME.color[0],
      showAxisTick: true,
      showAxisLabel: true,
      axisLabelDistance: 5,
      axisLabelFontFamily: PIVOT_CHART_FONT_FAMILIES[0].value,
      axisLabelFontSize: '12',
      axisLabelColor: PIVOT_DEFAULT_FONT_COLOR,
      showSplitLine: true,
      splitLineLength: 30,
      splitLineSize: '1',
      splitLineStyle: 'solid',
      splitLineColor: PIVOT_DEFAULT_AXIS_LINE_COLOR
    }
  }
}

export default liquidfill
conponents/Chart/config/chart 目录下添加progress.ts
//jeiiy
import ChartTypes from './ChartTypes'
import echarts from 'echarts'
import {
  PIVOT_CHART_FONT_FAMILIES,
  PIVOT_DEFAULT_FONT_COLOR,
  PIVOT_DEFAULT_AXIS_LINE_COLOR,
  CHART_FUNNEL_LABEL_POSITIONS,
  CHART_SORT_MODES,
  CHART_ALIGNMENT_MODES,
  DEFAULT_FONT_STYLE,
  DEFAULT_ECHARTS_THEME
} from 'app/globalConstants'

import { IChartInfo } from 'containers/Widget/components/Widget'

const progress: IChartInfo = {
  id: ChartTypes.Progress,
  name: 'progress',
  title: '进度图',
  icon: 'icon-chart-progress',
  coordinate: 'cartesian',
  rules: [{ dimension: 1, metric: [1, 9999] }],
  dimetionAxis: 'col',
  data: {
    cols: {
      title: '列',
      type: 'category'
    },
    rows: {
      title: '行',
      type: 'category'
    },
    metrics: {
      title: '指标',
      type: 'value'
    },
    filters: {
      title: '筛选',
      type: 'all'
    },
    color: {
      title: '颜色',
      type: 'category'
    },
    tip: {
      title: '提示信息',
      type: 'value'
    }
  },
  style: {
    progress: {
      radius: 75,
      splitNumber: 10,
      startAngle: 225,
      endAngle: -45,
      clockwise: true,
      max: 100,
      prefix: '',
      suffix: '%',
      showTitle: true,
      titleFontFamily: PIVOT_CHART_FONT_FAMILIES[0].value,
      titleFontSize: '16',
      titleColor: PIVOT_DEFAULT_FONT_COLOR,
      titleOffsetLeft: 0,
      titleOffsetTop: -40,
      showDetail: true,
      detailFontFamily: PIVOT_CHART_FONT_FAMILIES[0].value,
      detailFontSize: '28',
      detailColor: PIVOT_DEFAULT_FONT_COLOR,
      detailOffsetLeft: 0,
      detailOffsetTop: 40,
      showPointer: true,
      pointerLength: 80,
      pointerWidth: 8,
      customPointerColor: false,
      pointerColor: DEFAULT_ECHARTS_THEME.color[0],
      pointerBorderStyle: 'solid',
      pointerBorderWidth: 0,
      pointerBorderColor: PIVOT_DEFAULT_AXIS_LINE_COLOR,
      axisLineSize: 30,
      axisLineColor: DEFAULT_ECHARTS_THEME.color[0],
      showAxisTick: true,
      showAxisLabel: true,
      axisLabelDistance: 5,
      axisLabelFontFamily: PIVOT_CHART_FONT_FAMILIES[0].value,
      axisLabelFontSize: '12',
      axisLabelColor: PIVOT_DEFAULT_FONT_COLOR,
      showSplitLine: true,
      splitLineLength: 30,
      splitLineSize: '1',
      splitLineStyle: 'solid',
      splitLineColor: PIVOT_DEFAULT_AXIS_LINE_COLOR
    }
  }
}

export default progress
在conponents/Chart/render/chart目录下创建liquidfill.ts
/*
* <<
* Davinci
* ==
* Copyright (C) 2016 - 2017 EDP
* ==
* Licensed under the Apache License, Version 2.0 (the "License");
* you may not use this file except in compliance with the License.
* You may obtain a copy of the License at
*
* http://www.apache.org/licenses/LICENSE-2.0
*
* Unless required by applicable law or agreed to in writing, software
* distributed under the License is distributed on an "AS IS" BASIS,
* WITHOUT WARRANTIES OR CONDITIONS OF ANY KIND, either express or implied.
* See the License for the specific language governing permissions and
* limitations under the License.
* >>
*/
import Echarts from 'echarts'
/*
* jeiiy
*/
import { IChartProps } from '../../components/Chart'
import { decodeMetricName } from '../../components/util'
// import { EChartOption } from 'echarts'
import { getFormattedValue } from '../../components/Config/Format'
export default function (chartProps: IChartProps, drillOptions?: any) {
const { width, height, data, cols, metrics, chartStyles } = chartProps
const { axis, splitLine, liquidfill } = chartStyles
const {
radius,
splitNumber,
startAngle,
endAngle,
clockwise,
prefix,
suffix,
showTitle,
titleFontFamily,
titleFontSize,
titleColor,
titleOffsetLeft,
titleOffsetTop,
showDetail,
detailFontFamily,
detailFontSize,
detailColor,
detailOffsetLeft,
detailOffsetTop,
showPointer,
pointerLength,
pointerWidth,
customPointerColor,
pointerColor,
pointerBorderStyle,
pointerBorderWidth,
pointerBorderColor,
axisLineSize,
axisLineColor,
showAxisTick,
showAxisLabel,
axisLabelDistance,
axisLabelFontFamily,
axisLabelFontSize,
axisLabelColor,
showSplitLine,
splitLineLength,
splitLineSize,
splitLineStyle,
splitLineColor
} = liquidfill
const max = liquidfill.max || 100
const seriesObj = {}
const seriesArr = []
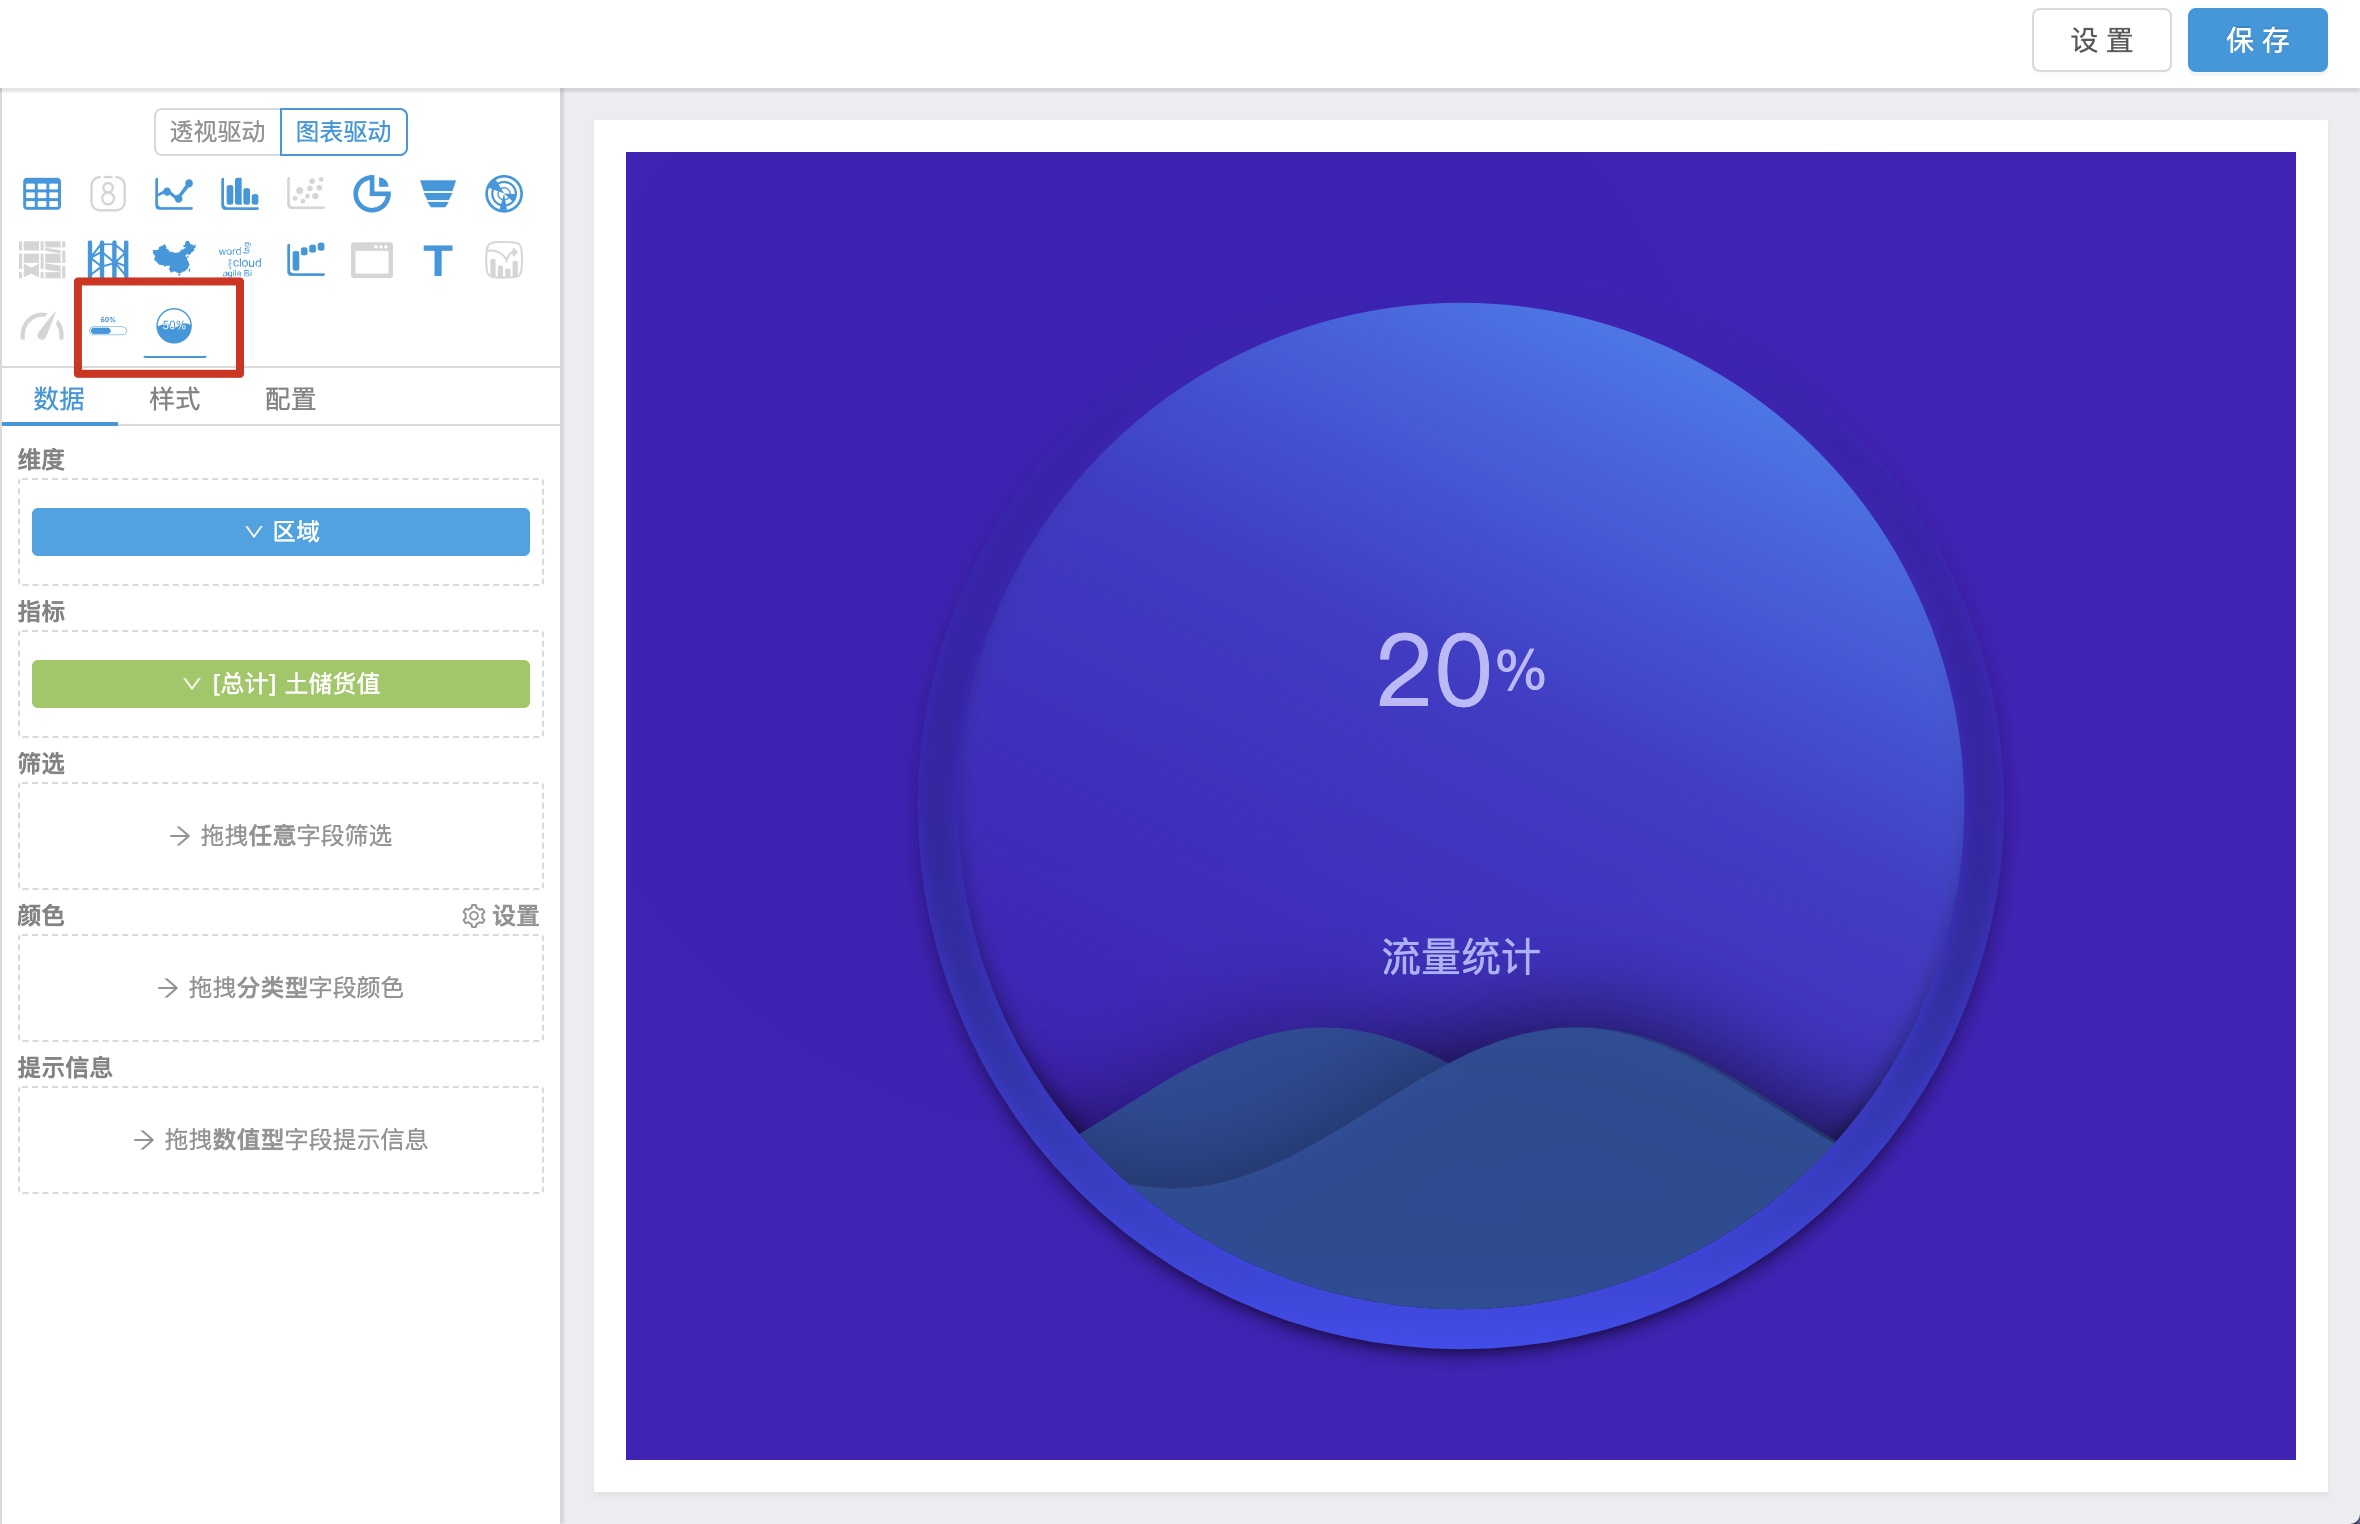
const value = 0.2
const datas = [value, value, value]
const options = {
backgroundColor: new Echarts.graphic.RadialGradient(0.3, 0.3, 0.8, [
{
offset: 0,
color: '#431ab8'
},
{
offset: 1,
color: '#471bba'
}
]),
title: {
text: `${(value * 100).toFixed(0)}{a|%}`,
textStyle: {
fontSize: 50,
fontFamily: 'Microsoft Yahei',
fontWeight: 'normal',
color: '#bcb8fb',
rich: {
a: {
fontSize: 28
}
}
},
x: 'center',
y: '35%'
},
graphic: [
{
type: 'group',
left: 'center',
top: '60%',
children: [
{
type: 'text',
z: 100,
left: '10',
top: 'middle',
style: {
fill: '#aab2fa',
text: '流量统计',
font: '20px Microsoft YaHei'
}
}
]
}
],
series: [
{
type: 'liquidFill',
radius: '80%',
center: ['50%', '50%'],
// shape: 'roundRect',
data: datas,
backgroundStyle: {
color: {
type: 'linear',
x: 1,
y: 0,
x2: 0.5,
y2: 1,
colorStops: [
{
offset: 1,
color: 'rgba(68, 145, 253, 0)'
},
{
offset: 0.5,
color: 'rgba(68, 145, 253, .25)'
},
{
offset: 0,
color: 'rgba(68, 145, 253, 1)'
}
],
globalCoord: false
}
},
outline: {
borderDistance: 0,
itemStyle: {
borderWidth: 20,
borderColor: {
type: 'linear',
x: 0,
y: 0,
x2: 0,
y2: 1,
colorStops: [
{
offset: 0,
color: 'rgba(69, 73, 240, 0)'
},
{
offset: 0.5,
color: 'rgba(69, 73, 240, .25)'
},
{
offset: 1,
color: 'rgba(69, 73, 240, 1)'
}
],
globalCoord: false
},
shadowBlur: 10,
shadowColor: '#000'
}
},
itemStyle: {
color: {
type: 'linear',
x: 0,
y: 0,
x2: 0,
y2: 1,
colorStops: [
{
offset: 1,
color: 'rgba(58, 71, 212, 0)'
},
{
offset: 0.5,
color: 'rgba(31, 222, 225, .2)'
},
{
offset: 0,
color: 'rgba(31, 222, 225, 1)'
}
],
globalCoord: false
}
},
label: {
normal: {
formatter: ''
}
}
}
]
}
metrics.forEach((m) => {
const decodedMetricName = decodeMetricName(m.name)
seriesArr.push(seriesObj)
})
// const tooltip: EChartOption.Tooltip = {
// trigger: 'item',
// formatter: '{b}: {c}'
// }
return options
}
conponents/Chart/render/chart 目录下创建progress.ts
/*
 * <<
 * Davinci
 * ==
 * Copyright (C) 2016 - 2017 EDP
 * ==
 * Licensed under the Apache License, Version 2.0 (the "License");
 * you may not use this file except in compliance with the License.
 * You may obtain a copy of the License at
 *
 *      http://www.apache.org/licenses/LICENSE-2.0
 *
 * Unless required by applicable law or agreed to in writing, software
 * distributed under the License is distributed on an "AS IS" BASIS,
 * WITHOUT WARRANTIES OR CONDITIONS OF ANY KIND, either express or implied.
 * See the License for the specific language governing permissions and
 * limitations under the License.
 * >>
 */

import Echarts from 'echarts'

/*
 * jeiiy
 */
import { IChartProps } from '../../components/Chart'
import { decodeMetricName } from '../../components/util'
// import { EChartOption } from 'echarts'
import { getFormattedValue } from '../../components/Config/Format'

export default function (chartProps: IChartProps, drillOptions?: any) {
  console.log('又进来了')
  const { width, height, data, cols, metrics, chartStyles } = chartProps

  const { axis, splitLine, progress } = chartStyles

  const {
    radius,
    splitNumber,
    startAngle,
    endAngle,
    clockwise,
    prefix,
    suffix,
    showTitle,
    titleFontFamily,
    titleFontSize,
    titleColor,
    titleOffsetLeft,
    titleOffsetTop,
    showDetail,
    detailFontFamily,
    detailFontSize,
    detailColor,
    detailOffsetLeft,
    detailOffsetTop,
    showPointer,
    pointerLength,
    pointerWidth,
    customPointerColor,
    pointerColor,
    pointerBorderStyle,
    pointerBorderWidth,
    pointerBorderColor,
    axisLineSize,
    axisLineColor,
    showAxisTick,
    showAxisLabel,
    axisLabelDistance,
    axisLabelFontFamily,
    axisLabelFontSize,
    axisLabelColor,
    showSplitLine,
    splitLineLength,
    splitLineSize,
    splitLineStyle,
    splitLineColor
  } = progress
  const max = progress.max || 100

  const seriesObj = {}
  const seriesArr = []

  const category = [
    {
      name: '累计完成',
      value: 612.5
    }
  ] // 类别
  const total = 1000 // 数据总数
  // const datas = []
  // category.forEach((value) => {
  //   datas.push(value.value)
  // })
  const options = {
    grid: {
      // 直角坐标系内绘图网格
      left: '80', // grid 组件离容器左侧的距离,
      // left的值可以是80这样具体像素值,
      // 也可以是'80%'这样相对于容器高度的百分比
      top: '80',
      right: '0',
      bottom: '0',
      containLabel: true // gid区域是否包含坐标轴的刻度标签。为true的时候,
      // left/right/top/bottom/width/height决定的是包括了坐标轴标签在内的
      // 所有内容所形成的矩形的位置.常用于【防止标签溢出】的场景
    },
    xAxis: {
      // 直角坐标系grid中的x轴,
      // 一般情况下单个grid组件最多只能放上下两个x轴,
      // 多于两个x轴需要通过配置offset属性防止同个位置多个x轴的重叠。
      type: 'value', // 坐标轴类型,分别有:
      // 'value'-数值轴;'category'-类目轴;
      // 'time'-时间轴;'log'-对数轴
      splitLine: { show: false }, // 坐标轴在 grid 区域中的分隔线
      axisLabel: { show: false }, // 坐标轴刻度标签
      axisTick: { show: false }, // 坐标轴刻度
      axisLine: { show: false } // 坐标轴轴线
    },
    yAxis: {
      type: 'category',
      axisTick: { show: false },
      axisLine: { show: false },
      axisLabel: {
        color: 'black',
        fontSize: 36
      },
      data: ['a'] // 类目数据,在类目轴(type: 'category')中有效。
      // 如果没有设置 type,但是设置了axis.data,则认为type 是 'category'。
    },
    series: [
      // 系列列表。每个系列通过 type 决定自己的图表类型
      {
        name: '%', // 系列名称
        type: 'bar', // 柱状、条形图
        barWidth: 19, // 柱条的宽度,默认自适应
        data: [20], // 系列中数据内容数组
        label: {
          // 图形上的文本标签
          show: true,
          position: 'right', // 标签的位置
          offset: [0, -40], // 标签文字的偏移,此处表示向上偏移40
          formatter: '{c}{a}', // 标签内容格式器 {a}-系列名,{b}-数据名,{c}-数据值
          color: 'black', // 标签字体颜色
          fontSize: 36 // 标签字号
        },
        itemStyle: {
          // 图形样式
          normal: {
            // normal 图形在默认状态下的样式;
            // emphasis图形在高亮状态下的样式
            barBorderRadius: 10, // 柱条圆角半径,单位px.
            // 此处统一设置4个角的圆角大小;
            // 也可以分开设置[10,10,10,10]顺时针左上、右上、右下、左下
            color: new Echarts.graphic.LinearGradient(0, 0, 1, 0, [
              {
                offset: 0,
                color: '#22B6ED'
              },
              {
                offset: 1,
                color: '#3FE279'
              }
            ])
          }
        },
        zlevel: 1 // 柱状图所有图形的 zlevel 值,
        // zlevel 大的 Canvas 会放在 zlevel 小的 Canvas 的上面
      },
      {
        name: '进度条背景',
        type: 'bar',
        barGap: '-100%', // 不同系列的柱间距离,为百分比。
        // 在同一坐标系上,此属性会被多个 'bar' 系列共享。
        // 此属性应设置于此坐标系中最后一个 'bar' 系列上才会生效,
        // 并且是对此坐标系中所有 'bar' 系列生效。
        barWidth: 19,
        data: [100],
        color: '#151B87', // 柱条颜色
        itemStyle: {
          normal: {
            barBorderRadius: radius
          }
        }
      }
    ]
  }

  metrics.forEach((m) => {
    const decodedMetricName = decodeMetricName(m.name)

    // seriesObj = {
    //   type: 'gauge',
    //   splitNumber,
    //   startAngle,
    //   endAngle,
    //   clockwise,
    //   max,
    //   radius: radius ? `${radius}%` : '75%',
    //   title: {
    //     show: showTitle,
    //     fontFamily: titleFontFamily,
    //     fontSize: titleFontSize,
    //     color: titleColor,
    //     offsetCenter: [
    //       titleOffsetLeft ? `${titleOffsetLeft}%` : 0,
    //       titleOffsetTop ? `${titleOffsetTop}%` : 0
    //     ]
    //   },
    //   detail: {
    //     show: showDetail,
    //     fontFamily: detailFontFamily,
    //     fontSize: detailFontSize,
    //     color: detailColor,
    //     offsetCenter: [
    //       detailOffsetLeft ? `${detailOffsetLeft}%` : 0,
    //       detailOffsetTop ? `${detailOffsetTop}%` : 0
    //     ],
    //     formatter: (value) => `${prefix}${getFormattedValue(Number(value) * 100 / max, m.format)}${suffix}`,
    //     // rich: {},
    //     //  240,
    //     // height: 240,
    //     // borderRadius: 120,
    //     // lineHeight: 240,
    //     // backgroundColor: '#05354a'
    //   },
    //   // animationDuration: 1000,
    //   // animationDurationUpdate: 1000,
    //   data: [{
    //     value: data.length ? data[0][`${m.agg}(${decodedMetricName})`] : 0,
    //     name: m.field.alias || decodedMetricName
    //   }],
    //   axisLine: {
    //     lineStyle: {
    //        axisLineSize,
    //       color: [
    //         [data.length ? data[0][`${m.agg}(${decodedMetricName})`] / max : 0, axisLineColor],
    //         [1, '#ddd']
    //       ]
    //     }
    //   },
    //   axisTick: {
    //     show: showAxisTick
    //   },
    //   axisLabel: {
    //     show: showAxisLabel,
    //     distance: axisLabelDistance,
    //     fontSize: axisLabelFontSize,
    //     fontFamily: axisLabelFontFamily,
    //     color: axisLabelColor
    //   },
    //   splitLine: {
    //     show: showSplitLine,
    //     length: splitLineLength,
    //     lineStyle: {
    //       color: splitLineColor,
    //        splitLineSize,
    //       type: splitLineStyle
    //     }
    //   },
    //   pointer: {
    //     show: showPointer,
    //     length: pointerLength ? `${pointerLength}%` : 0,
    //      pointerWidth
    //   },
    //   itemStyle: {
    //     color: customPointerColor ? pointerColor : 'auto',
    //     borderType: pointerBorderStyle,
    //     borderWidth: pointerBorderWidth,
    //     borderColor: pointerBorderColor
    //   }
    // }
    seriesArr.push(seriesObj)
  })

  // const tooltip: EChartOption.Tooltip = {
  //   trigger: 'item',
  //   formatter: '{b}: {c}'
  // }

  return options
}
修改 conponents/Chart/render/chart/index.ts
import progress from './progress'
import liquidfill from './liquidfill'

switch 方法中添加下面逻辑
case 'progress':
  return progress(chartProps, drillOptions)
case 'liquidfill':
  return liquidfill(chartProps, drillOptions)