首先我们要试验的是 人体脂肪fat和年龄age以及体重weight之间的关系,我们的目标就是得到一个最优化的平面来表示三者之间的关系:
TensorFlow的程序如下:
import tensorflow as tf
import numpy as np
import matplotlib.pyplot as plt
W = tf.Variable(tf.zeros([2, 1], name="weight_age"))
b = tf.Variable(0.0, name="bias")

def inference(X):
    return tf.matmul(X, W) + b

def loss(X, Y):
    Y_predicted = inference(X)
    return tf.reduce_sum(tf.square(Y-Y_predicted))

def inputs():
    weight_age = [[84,46],[93,20],[65,52],[70,30],[76,57],[69,25],[63,28],[72,36],[79,57],[75,44]
                 ,[27,24],[89,31],[65,52],[57,23],[59,60],[69,48],[60,34],[79,51],[75,50],[82,34]
                 ,[59,46],[67,23],[85,37],[55,40],[63,30]]
    blood_fat_content = [354,190,405,263,451,302,288,385,402,365,209,290,346
                         ,254,395,434,220,374,308,220,311,181,274,303,244]
    return tf.to_float(weight_age), tf.to_float(blood_fat_content)

def train(total_loss):
    learning_rate = 0.00000001
    return tf.train.GradientDescentOptimizer(learning_rate).minimize(total_loss)

def evaluate(sess, X, Y):
    print sess.run(inference([[80., 25.]]))
    print sess.run(inference([[65., 25.]]))

init = tf.global_variables_initializer()

with tf.Session() as sess:
    sess.run(init)
    X, Y = inputs()
    total_loss = loss(X, Y)
    print "The total_loss:",total_loss
    train_op = train(total_loss)
    training_steps = 10000
    for step in range(training_steps):
        sess.run([train_op])
        if step % 1000 == 0:
            print "loss:", sess.run([total_loss])
    evaluate(sess, X, Y)
   print 'W is:',W.eval()
   print 'b is:',b.eval()
    sess.close()
程序中的数据散点图如下:

通过TensorFlow得到的最终的W的取值和b的取值如下所示:
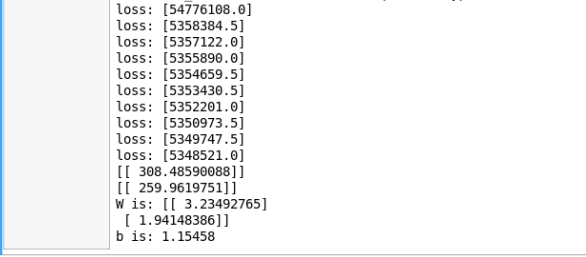
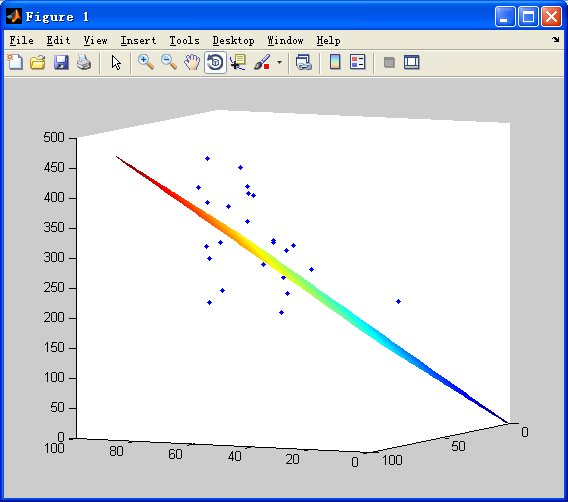
现在我们将得到的W的数据和b的数据绘制平面(MATLAB程序如下):
% TensorFlow Data Plot Script For Matlab%
weight_age = [[84,46];[93,20];[65,52];[70,30];[76,57];[69,25];[63,28];[72,36];
    [79,57];[75,44];[27,24];[89,31];[65,52];[57,23];[59,60];[69,48];[60,34];
    [79,51];[75,50];[82,34];[59,46];[67,23];[85,37];[55,40];[63,30]];  % 25*2
weight = weight_age(:,1); %25*1
age = weight_age(:,2); %25*1
blood_fat_content = [354,190,405,263,451,302,288,385,402,365,209,290,346,254,395,434,220,374,308,220,311,181,274,303,244]; % 1*25
Fat = zeros(max(weight),max(age));
for i=1:25
    Fat(weight(i),age(i)) = blood_fat_content(i);
end
figure,plot3(weight,age,blood_fat_content','.')
hold on

% 平面拟合
A = 3.23492765;
B = 1.94148386;
C = 1.15458;
[x,y] = meshgrid(0:1:90);
z = A*x+B*y+C;

mesh(z)
结果图如下所示:
注:这里在实验的过程中,碰到一些问题,当我把learning_rate设置为0.000001时,未能得到相应的结果,total_loss=nan,也就是说梯度下降法的过程没有收敛,导致无法得到相应的数据结果!(还需要注意你的是python3还是Python2,这里的print 需要修改一下哦!)关于参数设定的学习还是慢慢来吧~