ELK是啥子???
ELK 是elastic公司提供的一套完整的日志收集以及展示的解决方案,是三个产品的首字母缩写,分别是ElasticSearch、Logstash 和 Kibana。
特点:
收集-能够采集多种来源的日志数据
传输-能够稳定的把日志数据传输到中央系统
存储-如何存储日志数据
分析-可以支持 UI 分析
警告-能够提供错误报告,监控机制
Elasticsearch是个开源分布式搜索引擎,提供搜集、分析、存储数据三大功能。
特点:分布式,零配置,自动发现,索引自动分片,索引副本机制,restful风格接口,多数据源,自动搜索负载等。
Logstash 主要是用来日志的搜集、分析、过滤日志的工具,支持大量的数据获取方式。
一般工作方式为c/s架构,client端安装在需要收集日志的主机上,server端负责将收到的各节点日志进行过滤、修改等操作在一并发往elasticsearch上去。
Kibana 也是一个开源和免费的工具,Kibana可以为 Logstash 和 ElasticSearch 提供的日志分析友好的 Web 界面,可以帮助汇总、分析和搜索重要数据日志。
Filebeat隶属于Beats。目前Beats包含四种工具:
Packetbeat(搜集网络流量数据)
Topbeat(搜集系统、进程和文件系统级别的 CPU 和内存使用情况等数据)
Filebeat(搜集文件数据)
Winlogbeat(搜集 Windows 事件日志数据)
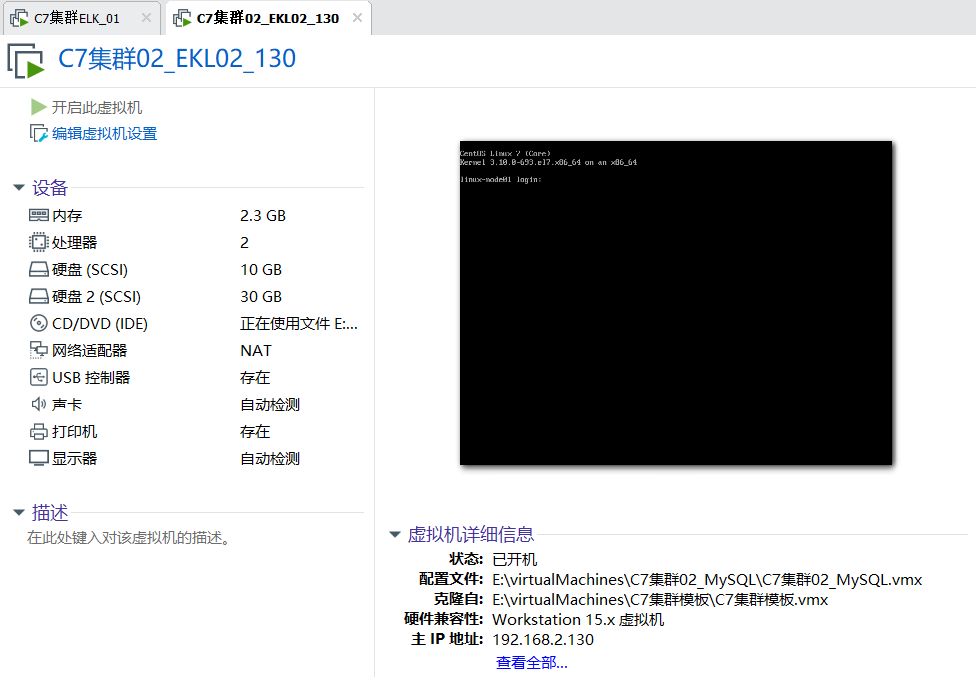
第一步:环境基本配置:配置主机名和磁盘挂载,两个节点都要配置
提前添加30G的硬盘,这家伙统计日志量真的很大,提前给好空间,内存配置至少得2G以上,我一开始是1G,结果服务老是失败,看情况而定,多给一点,还是比较好的
[root@linux-node01 ~]# cat /etc/redhat-release
CentOS Linux release 7.4.1708 (Core) #我的机子是Centos7.4,咋说也得七以上吧,六没试
[root@linux-node01 ~]# uname -a
Linux linux-node01 3.10.0-693.el7.x86_64 #1 SMP Tue Aug 22 21:09:27 UTC 2017 x86_64 x86_64 x86_64 GNU/Linux
注意一下,本文配置显示结果只是显示要添加的部分,配置比较全,也比较详细,写给对ELK蠢蠢欲动缺不敢动的你们,嘿嘿嘿
[root@linux-node01 ~]# cat /etc/hosts #两个节点都要写
192.168.2.130 linux-node01 linux-node1.example.com
192.168.2.132 linux-node02 linux-node2.example.com
[root@linux-node01 ~]fdisk -l /dev/sdb #查看你添加的硬盘设备是否存在
[root@linux-node01 ~]mkfs.xfs /dev/sdb #加磁盘之后分区,然后格式化,这是一个基本的操作流程,这里我就不分区了,直接使用格式化,文件系统的类型问xfs
[root@linux-node01 ~]# blkid /dev/sdb #查看一下UUID和类型
/dev/sdb: UUID="dc0f16bb-ae77-4a16-b1c7-b51d3f4b6e32" TYPE="xfs"
[root@linux-node01 ~]# mkdir /elk
[root@linux-node01 ~]# cat /etc/fstab #加入开机自动挂载
UUID="dc0f16bb-ae77-4a16-b1c7-b51d3f4b6e32" /elk xfs defaults 0 0 #把这行加进去就ok
[root@linux-node01 ~]# mount -a #挂载一下子,直接all
[root@linux-node01 ~]# df -TH # df 的参数H和h差不多都是以人类可读的方式显示,只不过H的基准是1000而不是1024,所以看的时候多出来3G,实际空间大小为30G
/dev/sdb xfs 33G 34M 33G 1% /elk #看到这个就说明我们将磁盘挂载成功了
******以上的主机名和磁盘在两个节点都是要添加的*******
第二步:安装elasticsearch和java环境 ,两个节点都要安装配置
[root@linux-node01 ~]# ls
#将rpm的包下载到本地,可以去官网直接下载选择版本,我参考的资料有点老,但是功能不影响,就用5.6.5了,路先走通,才能变通,不要觉得版本旧就不尝试,新的东西资料少,错误多,
a anaconda-ks.cfg elasticsearch-5.6.5.rpm jdk-8u151-linux-x64.rpm #这里注意一下,你去官网看的时候它对JAVA的版本有一个说明
[root@linux-node01 ~]# yum -y install *.rpm # *就是所有啦,以前觉得学东西没有啥子用,到了用的时候就觉得真方便,一个符号就能代替所有,呼哈
Installed:
elasticsearch.noarch 0:5.6.5-1 jdk1.8.x86_64 2000:1.8.0_151-fcs
Complete! #看到这个就说明java环境和elasticsearch安装好了 ,安装这两个包,也可以二进制安装,两个node都要安装
[root@linux-node02 ~]# yum -y install iotop #安装一个io查看工具 ,从名字就能看出和top用法一样,专门针对IO的
第三步:修改elasticsearch配置文件
关闭防火墙和selinux ,
systemctl stop firewalld
临时修改 setenforce 0
永久修改/etc/selinux/conf 中 SELINUX=disabled
node2修改
[root@linux-node02 ~]# vim /etc/elasticsearch/elasticsearch.yml
[root@linux-node02 elasticsearch]# egrep -v "^#" elasticsearch.yml #最后修改之后的配置如下,这七行都要添加
cluster.name: elk-cluster1 # 集群名字,同一个集群名字必须相同,学学英语,很重要
node.name: elk-node-2 #节点2的名字,起名大法
path.data: /elk # elk的数据存放目录
path.logs: /elk/logs #elk的日志存放目录,一定要记住这个目录,有啥错误看日志,说明,不要一脸懵逼的挠头,都TM挠成地中海了
network.host: 192.168.2.132 #主机的地址啦,node2的IP地址是192.168.2.132
http.port: 9200 #默认端口9200 ,最后查看服务是否启动成功,看端口啊,排查故障,看网络,看端口
discovery.zen.ping.unicast.hosts: ["192.168.2.130", "192.168.2.132"] #这里可以写成网段,但是广播很耗费性能,本来内存就不大,直接就改成组播,就这俩就行
[root@linux-node02 ~]# vim /usr/lib/systemd/system/elasticsearch.service #查看这个文件的时候你会看到这几行,和MySQL类似,就是对文件的用户和用户组添加一下就ok,切忌不要改文件属性为777,你是傻子么??????
User=elasticsearch
Group=elasticsearch
[root@linux-node02 ~]#systemctl start elasticsearch #启动服务,开始我们的游戏
[root@linux-node02 ~]#systemctl enable elasticsearch #开机自启动
[root@linux-node02 ~]#vim /var/log/messages #查看一下日志报什么错误,有个权限拒绝类似的,就是说上面没有对/elk文件没有权限
[root@linux-node02 ~]# chown -R elasticsearch.elasticsearch /elk/ #添加用户和用户组,-R :就是说对整个文件夹下面的内容都要这么操作,也就是所谓的递归
[root@linux-node02 ~]# ll /elk/ #现在整个文件夹下啥都没有,启动成功之后你就在这里能看到日志文件了,有错误找这里,然后去百度找一找
total 0
[root@linux-node02 ~]# ll /elk/ -d
drwxr-xr-x. 2 elasticsearch elasticsearch 6 Oct 16 20:25 /elk/
#这里有一个错误就是因为我内存给的1G,日志显示内存不足以支持配置,调大内存为2G,重新启动服务
[root@linux-node02 ~]# ss -ntl
State Recv-Q Send-Q Local Address:Port Peer Address:Port
LISTEN 0 128 *:22 *:*
LISTEN 0 100 127.0.0.1:25 *:*
LISTEN 0 128 ::ffff:192.168.2.132:9200 :::*
LISTEN 0 128 ::ffff:192.168.2.132:9300 :::*
#systemctl stop firewalld 关闭防火墙啦,如果你在浏览器查看不到效果,看你防火墙关没关
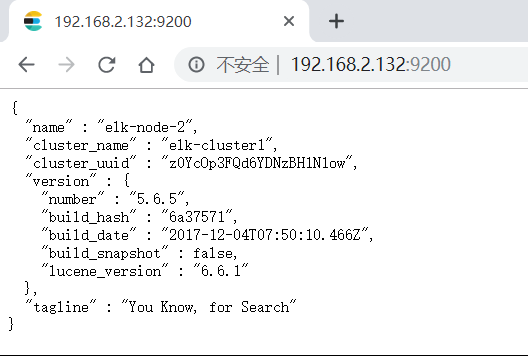
测试:浏览器查看一下
node1修改
如果不想修改,可以直接把2的文件拷到这边,再稍微改动一下,主要针对节点名和主机地址
[root@linux-node01 ~]# egrep -v "^#" /etc/elasticsearch/elasticsearch.yml
cluster.name: elk-cluster1
node.name: elk-node-1
path.data: /elk
path.logs: /elk/logs
network.host: 192.168.2.130
http.port: 9200
discovery.zen.ping.unicast.hosts: ["192.168.2.130", "192.168.2.132"]
[root@linux-node01 ~]# systemctl start elasticsearch
[root@linux-node01 ~]# ll /elk/
total 0
drwxr-xr-x. 2 elasticsearch elasticsearch 158 Oct 16 22:03 logs
drwxr-xr-x. 3 elasticsearch elasticsearch 15 Oct 16 22:03 nodes
[root@linux-node01 ~]# ss -ntl
State Recv-Q Send-Q Local Address:Port Peer Address:Port
LISTEN 0 128 *:22 *:*
LISTEN 0 100 127.0.0.1:25 *:*
LISTEN 0 128 ::ffff:192.168.2.130:9200 :::*
LISTEN 0 128 ::ffff:192.168.2.130:9300 :::*
第三步:安装npm然后运行head插件测试一下
#mkdir /usr/local/node
#cd /usr/local/node
#wget https://npm.taobao.org/mirrors/node/v4.4.7/node-v4.4.7-linux-x64.tar.gz
#tar -zxvf node-v4.4.7-linux-x64.tar.gz
#ln -s /usr/local/node/node-v4.4.7-linux-x64/bin/npm /usr/local/bin/npm
#ln -s /usr/local/node/node-v4.4.7-linux-x64/bin/node /usr/local/bin/node
#npm -v
去网上找这个插件elasticsearch-head,找不到也可以直接pass做下一步
#cd /usr/local/src/elasticsearch-head #必须进入这个目录才可以,否则报错
#npm run start & 执行之后查看端口会发现9100

玩到这里你会发现这个插件不能连接,去修改主配置文件/etc/elasticsearch/elasticsearch.yml,增加这两行内容
http.cors.enabled: true
http.cors.allow-origin: "*"

成功连接到集群
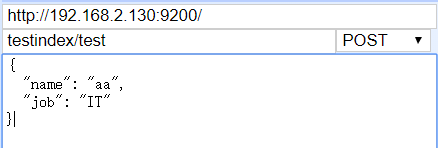
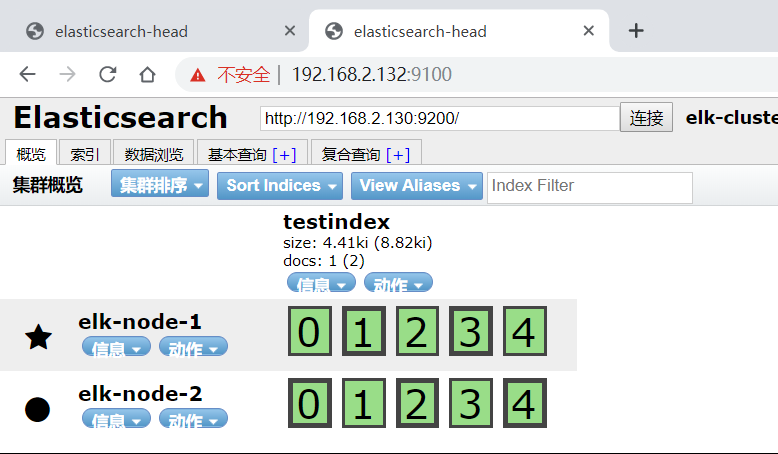

玩一玩,点一点,测试一下
第四步:监控平台健康值
[root@linux-node01 elasticsearch-head]# curl –sXGET http://192.168.2.132:9200/_cluster/health?pretty=true
curl: (6) Could not resolve host: xn--sxget-xu3b; Name or service not known
{
"cluster_name" : "elk-cluster1",
"status" : "green",
"timed_out" : false,
"number_of_nodes" : 2,
"number_of_data_nodes" : 2,
"active_primary_shards" : 5,
"active_shards" : 10,
"relocating_shards" : 0,
"initializing_shards" : 0,
"unassigned_shards" : 0,
"delayed_unassigned_shards" : 0,
"number_of_pending_tasks" : 0,
"number_of_in_flight_fetch" : 0,
"task_max_waiting_in_queue_millis" : 0,
"active_shards_percent_as_number" : 100.0
}
通过这个命令可以写一个脚本来监控系统健康状态
第五步:安装logstash,这个是你要检测的系统或服务器需要安装,在node2安装,node1不需要
#cd /usr/local/src/
# ls #把logstash的rpm软件包传上去
elasticsearch-head elasticsearch-head.tar.gz logstash-5.6.5.rpm
[root@linux-node02 src]# yum -y install logstash-5.6.5.rpm
#/usr/share/logstash/bin/logstash --help #命令帮助信息
-t, --config.test_and_exit Check configuration for valid syntax and then exit. #测试配置文件格式是否正确
-f, --path.config CONFIG_PATH #指定文件
测试一下
#/usr/share/logstash/bin/logstash -e 'input { stdin{} } output { stdout{ codec => rubydebug }}' #它的主要功能input和output两个模块,注意格式不要错
The stdin plugin is now waiting for input:
123 #输入123,输出格式化标准信息,说明么有问题,可以使用
{
"@version" => "1",
"host" => "linux-node02",
"@timestamp" => 2019-10-17T02:32:14.783Z,
"message" => "123"
}
[root@linux-node02 conf.d]# /usr/share/logstash/bin/logstash -e 'input { stdin{} } output { file { path=> "/tmp/a.txt" }}' #修改输出模块,直接输出到一个目录文件中,
[root@linux-node02 ~]# tail /tmp/a.txt
{"@version":"1","host":"linux-node02","@timestamp":"2019-10-17T02:37:52.832Z","message":"dffd"}
{"@version":"1","host":"linux-node02","@timestamp":"2019-10-17T02:37:54.464Z","message":"123"}
{"@version":"1","host":"linunode02","@timestamp":"2019-10-17T02:37:55.717Z","message":"fdfdf"}
测试配置文件书写格式是否正确,如果错误会有提示
[root@linux-node02 conf.d]# /usr/share/logstash/bin/logstash -f /etc/logstash/conf.d/systemlog.conf -t #利用上面的格式,我们来写一个将系统日志的内容输出到一个测试文件中,-t测试文件格式
WARNING: Could not find logstash.yml which is typically located in $LS_HOME/config or /etc/logstash. You can specify the path using --path.settings. Continuing using the defaults
Could not find log4j2 configuration at path /usr/share/logstash/config/log4j2.properties. Using default config which logs errors to the console
Configuration OK
文件内容 /etc/logstash/conf.d/systemlog.conf
input{
file{
path => "/var/log/messages"
start_position => "beginning"
type => "systemlog-132"
stat_interval => "2"
}
}
output{
elasticsearch {
hosts => ["192.168.2.11:9200"]
index => "logstash-system-log-132-%{+YYYY.MM.dd}" #基础啦,这个要是看不懂,就去看书去吧,意思是按照年月日的格式来输出
}
file{
path => "/tmp/logstash.txt"
}
} #注意大括号是成双成对的
启动的时候发现我的systemctl start lsgstash 不好使,百度一下,如下步骤解决,
[root@linux-node02 conf.d]# /usr/share/logstash/bin/system-install /etc/logstash/startup.options systemd
Using provided startup.options file: /etc/logstash/startup.options
Manually creating startup for specified platform: systemd
Successfully created system startup script for Logstash
[root@linux-node02 conf.d]# systemctl start logstash
#cat /var/log/logstash/logstash-plain.log #看日志最后一行的Successfully 你懂的啦
[2019-10-17T11:14:48,947][INFO ][logstash.agent ] Successfully started Logstash API endpoint {:port=>9600}
正常的话会看到两个java程序 ,
做到这里发现/tmp目录下没有我们刚才输出的那个文件,查了一下,是因为日志文件对其他人没有权限,改一下吧,644
#chmod 644 /var/log/messages
#tail /tmp/logstash.txt 可以看到日志输出到了这里,恭喜你,做到这里,还有一步就能最后看到WEB管理界面了
第六步:kibana安装,node1节点安装
[root@linux-node01 ~]# ls #老套路,把rpm包上传到这里,然后yum install -y kibana-5.6.5-x86_64.rpm 安装就好了
elasticsearch-5.6.5.rpm kibana-5.6.5-x86_64.rpm
[root@linux-node01 ~]# egrep -v "^#|^$" /etc/kibana/kibana.yml #修改一下配置文件
server.port: 5601 #默认服务端口
server.host: "192.168.2.130" #服务主机的地址,我们这里写自己的IP地址
elasticsearch.url: "http://192.168.2.132:9200" #要收集日志的目的地,elasticsearch的url和端口
启动服务
[root@linux-node01 ~]# systemctl start kibana
测试
[root@linux-node01 ~]# ss -nlt
State Recv-Q Send-Q Local Address:Port Peer Address:Port
LISTEN 0 128 *:9100 *:* #9100是head插件的端口
LISTEN 0 128 *:22 *:*
LISTEN 0 100 127.0.0.1:25 *:*
LISTEN 0 128 192.168.2.130:5601 *:* #5601是kibana默认的端口
LISTEN 0 128 ::ffff:192.168.2.130:9200 :::* #9200和9300是elasticsearch默认的端口
LISTEN 0 128 ::ffff:192.168.2.130:9300 :::*
LISTEN 0 128 :::22 :::*
LISTEN 0 100 ::1:25 :::*
有了端口,就去浏览器看一下
[root@linux-node02 ~]# ss -nlt #看一下node2 的端口信息,
State Recv-Q Send-Q Local Address:Port Peer Address:Port
LISTEN 0 128 *:22 *:*
LISTEN 0 100 127.0.0.1:25 *:*
LISTEN 0 128 ::ffff:192.168.2.132:9200 :::*
LISTEN 0 128 ::ffff:192.168.2.132:9300 :::*
LISTEN 0 128 :::22 :::*
LISTEN 0 100 ::1:25 :::*
LISTEN 0 50 ::ffff:127.0.0.1:9600 :::* #9600是logstash默认的端口,没有这几个端口就说明你的服务没有开启
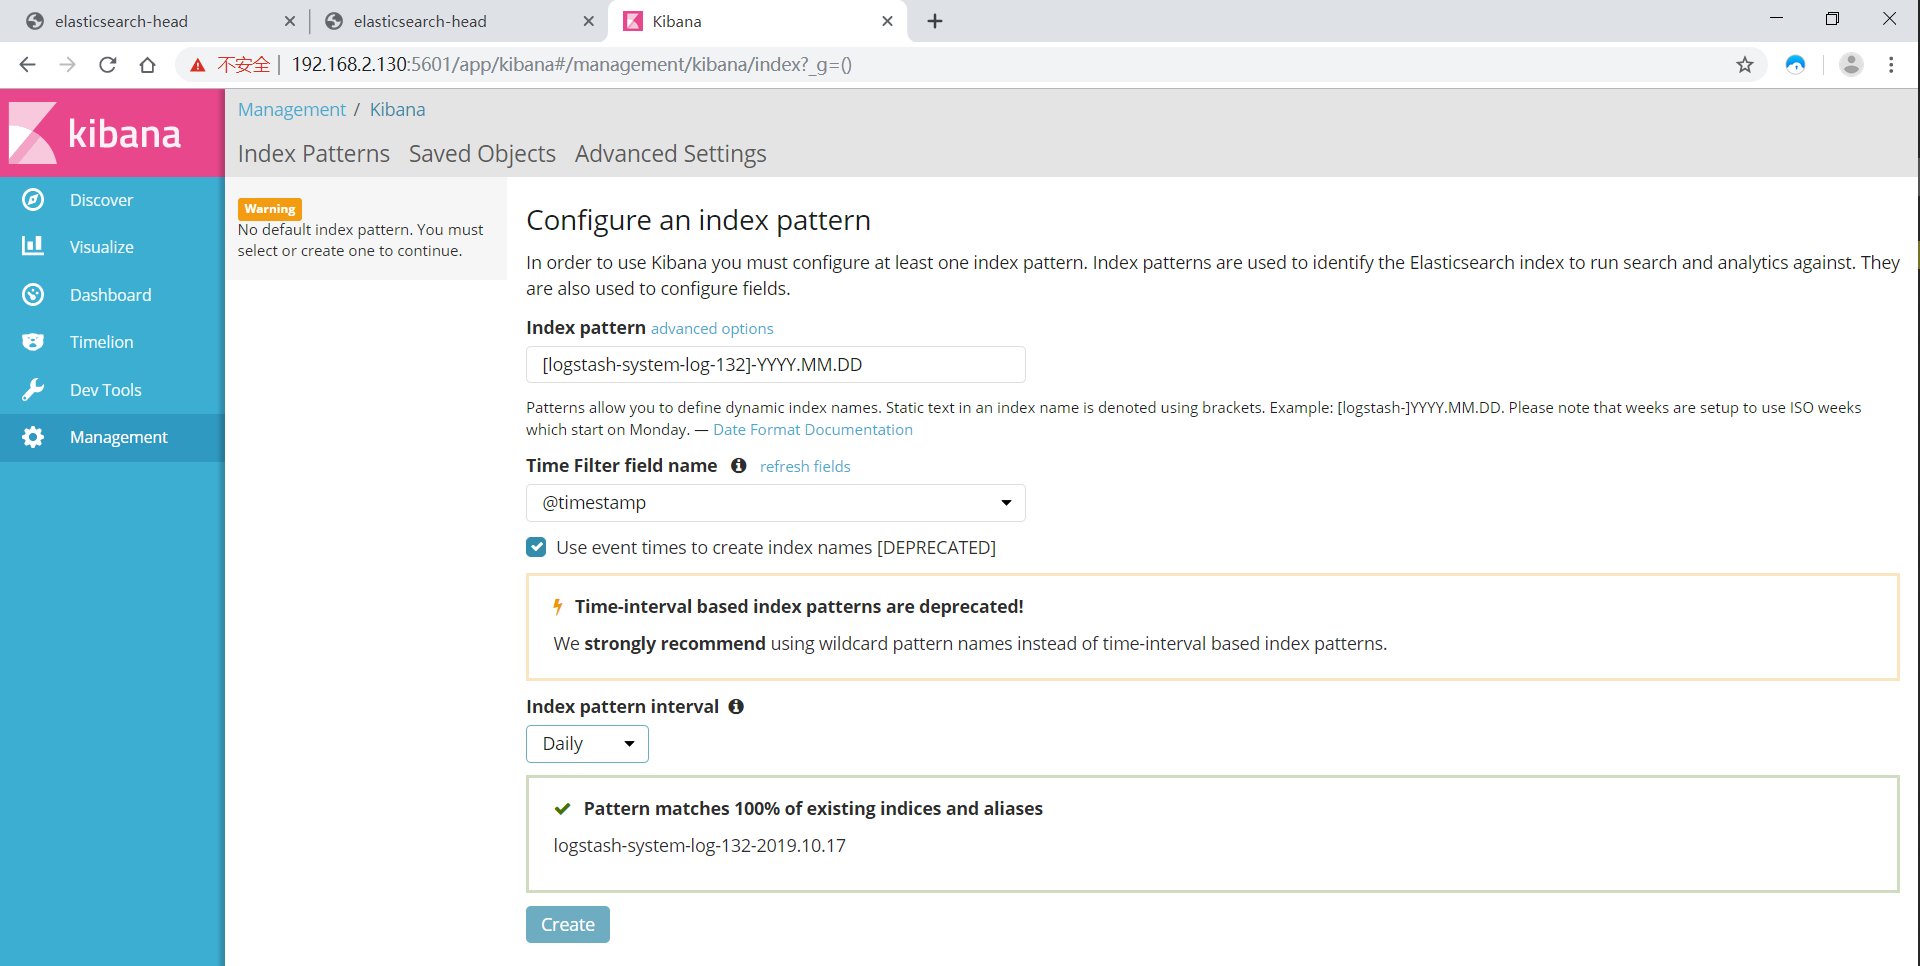
刚开始是没有信息的,需要我们添加一个索引模式,就按照我们刚才系统日志测试的来,注意要选择间隔,看你是每天还是每小时,可以自己调试
[logstash-system-log-132]-YYYY.MM.DD
如果发现页面时间不一样,配置ntp服务器,时间一定要全网同步,不然。。。。。

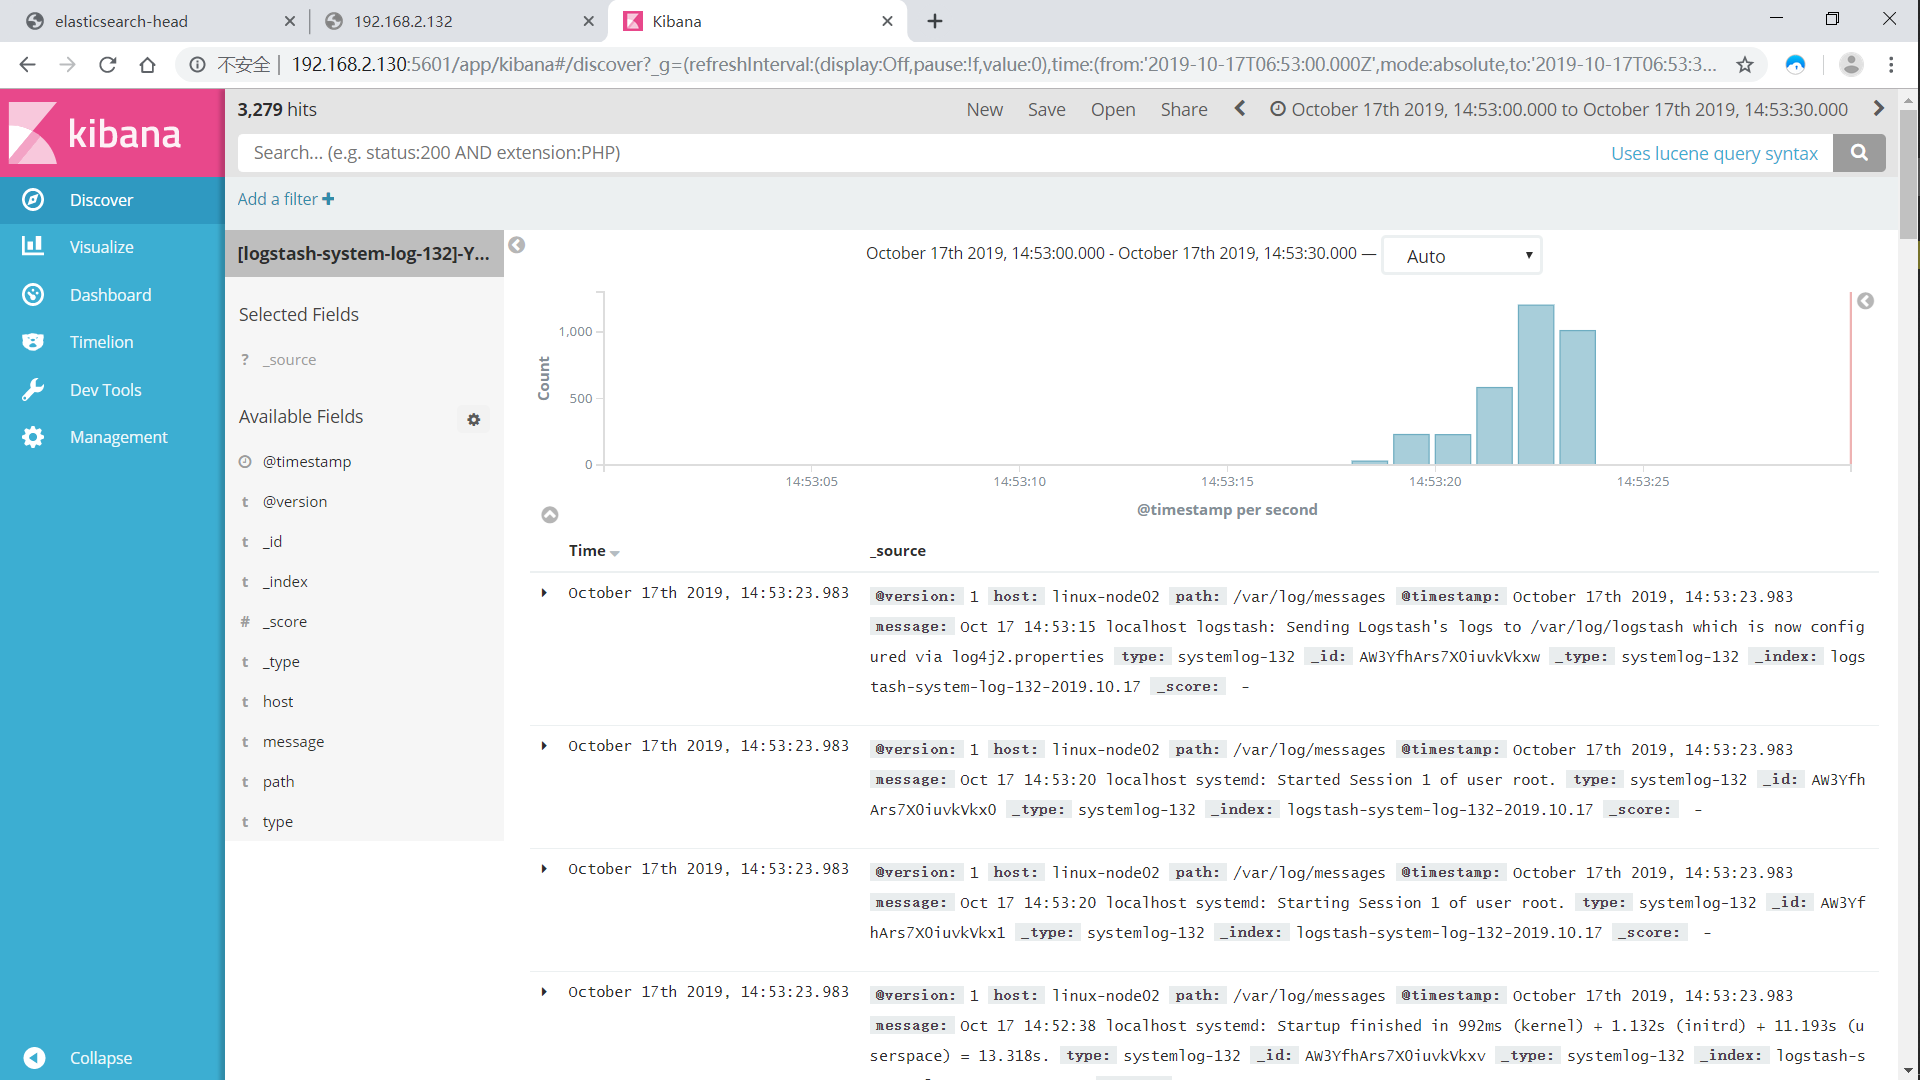
做到这里,我们的ELK三件套就算全部按照完成了,暂时功德圆满,还有很多可以玩,添加logstash的配置文件,测试Apache或者nginx,你想咋玩就咋玩,记住这是一个日志审计平台
Apache服务日志
编辑配置/etc/logstash/conf.d/apache_log.conf
input { file {path => "/etc/httpd/logs/access_log" type => "access" start_position => "beginning"}
file { path => "/etc/httpd/logs/error_log" type => "error" start_position => "beginning" } }
output { if [type] == "access" { elasticsearch { hosts => ["10.0.0.133:9200"] index => "apache_access-%{+YYYY.MM.dd}" } }
if [type] == "error" { elasticsearch { hosts => ["10.0.0.133:9200"] index => "apache_error-%{+YYYY.MM.dd}" } } }
GAME OVER !!!!!! 码字不易,各位看官加个关注吧,秒回关的那种