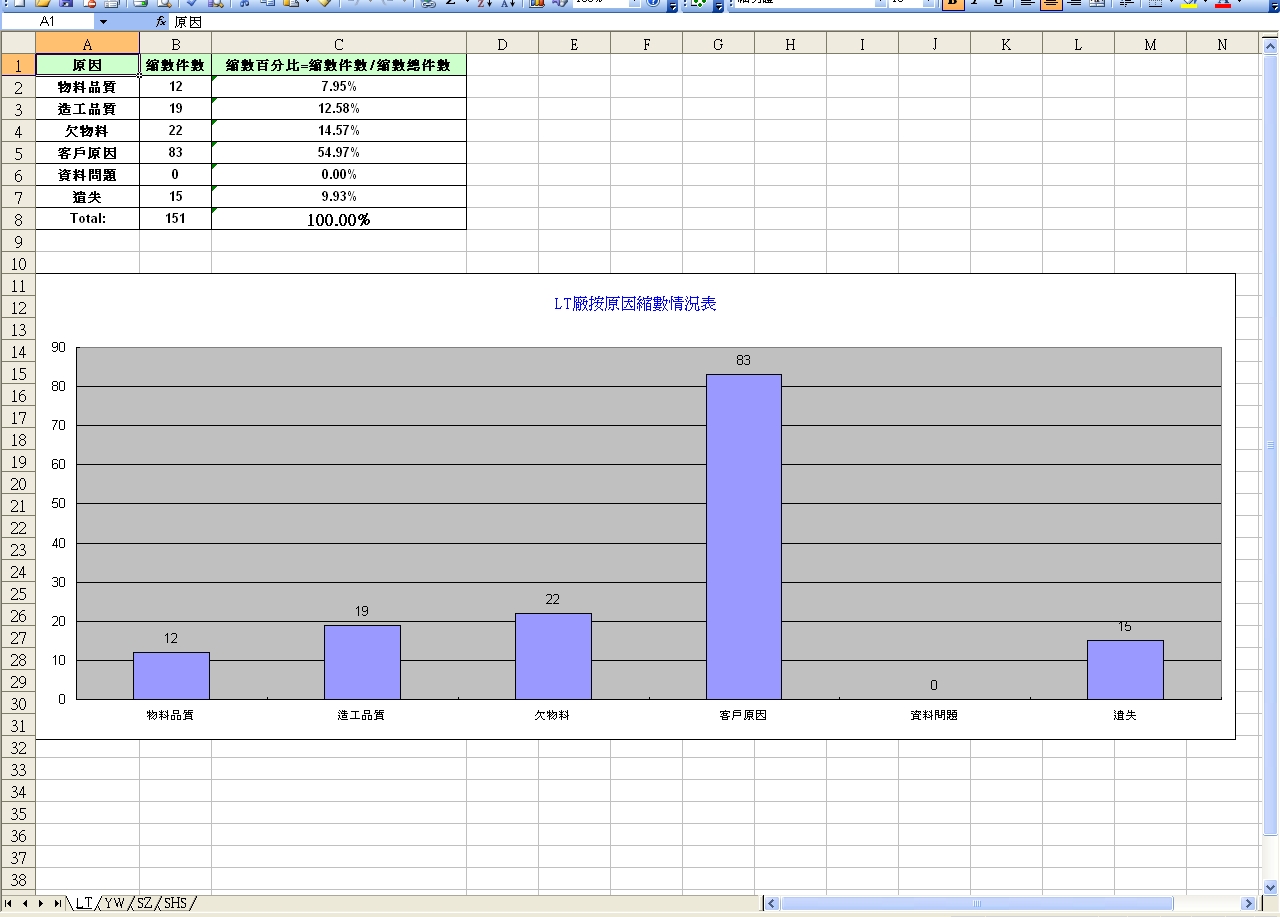
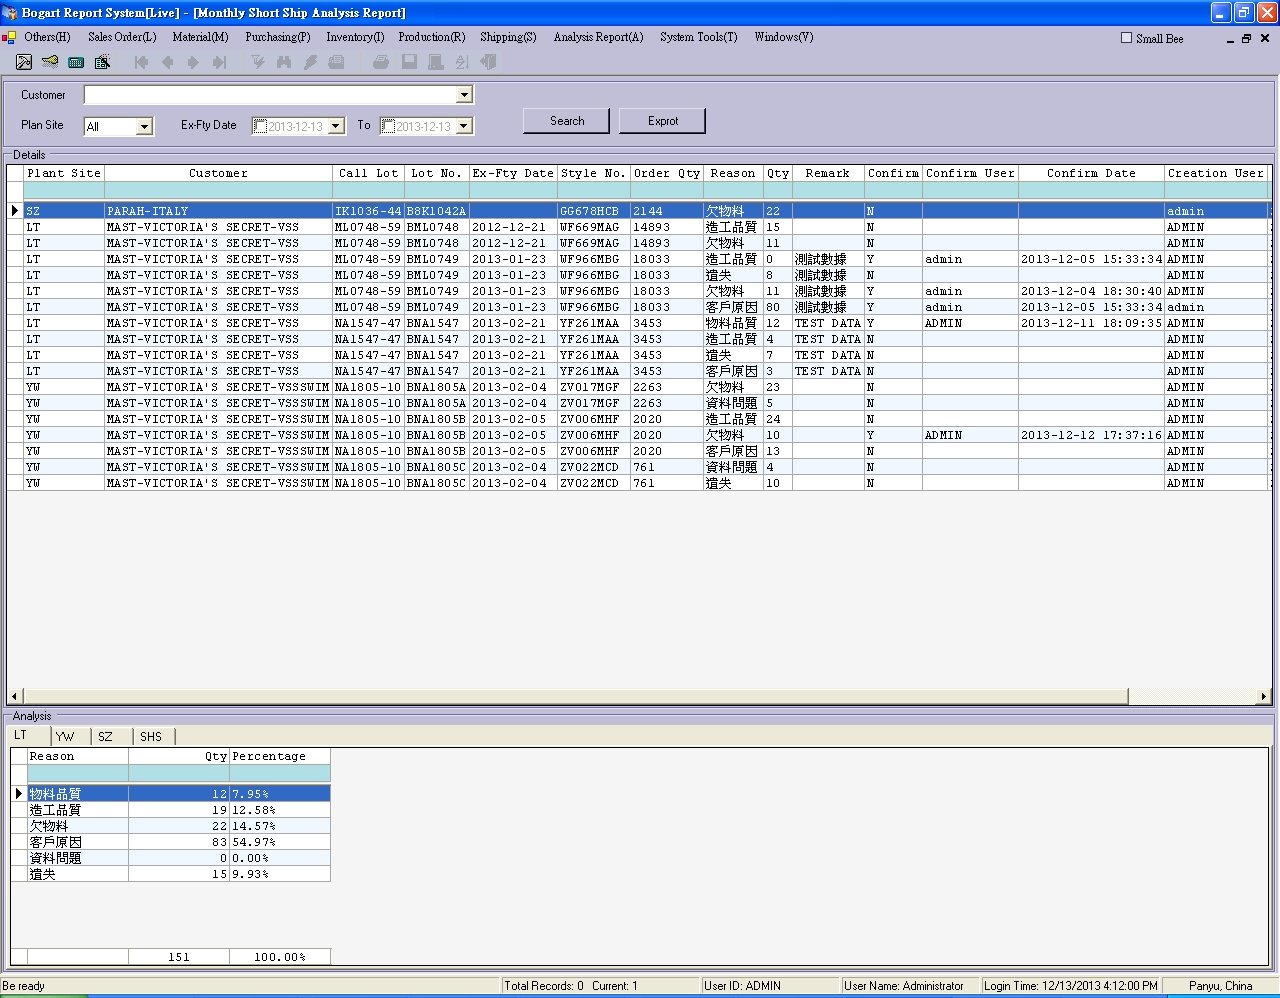
Private Sub btnExprot_Click(ByVal sender As System.Object, ByVal e As System.EventArgs) Handles btnExprot.Click
        If Not T Is Nothing Then
            If T.ThreadState = ThreadState.Running Then Exit Sub
        End If
        T = New Thread(AddressOf Export)
        T.Start()
    End Sub

    Private Sub Export()
        Dim xApp = New Excel.Application
        Dim xBook As Excel.Workbook
        Dim xSheet As New Excel.Worksheet
        Dim charts As Object
        Me.Cursor = Cursors.WaitCursor
        Try
            xBook = xApp.Workbooks.Add(Application.StartupPath & "TempletsMonthly Short Ship Analysis Report.xlt")
            'one plant site one sheet
            For i As Integer = 1 To ds.Tables.Count - 1
                xSheet = xBook.Worksheets(i)
                xSheet.Name = ds.Tables(i).TableName
                xSheet.Activate()
                xSheet.Application.WindowState = Excel.XlWindowState.xlMaximized
                xSheet.Cells.NumberFormatLocal = "@" '數值型轉字符串,防止出現6.54655E+11
                xApp.DisplayAlerts = False

                'data
                '------------------------------------------------------------------------------------
                Dim data(ds.Tables(i).Rows.Count + 1, 3) As Object
                Dim j As Integer
                Dim qty As Integer = 0
                For j = 0 To ds.Tables(i).Rows.Count - 1
                    xSheet.Range("A3").Resize(1, 3).Insert(Shift:=Excel.XlDirection.xlDown)
                    data(j, 0) = ds.Tables(i).Rows(j).Item("reason")
                    data(j, 1) = ds.Tables(i).Rows(j).Item("qty")
                    data(j, 2) = ds.Tables(i).Rows(j).Item("percentage")
                    qty += ds.Tables(i).Rows(j).Item("qty")
                Next
                data(j, 0) = "Total:"
                data(j, 1) = qty
                data(j, 2) = IIf(qty > 0, "100.00%", "0.00%")
                xSheet.Range("A3").Resize(1, 3).Delete()
                xSheet.Range("A2").Resize(ds.Tables(i).Rows.Count + 1, 3).Value = data
                '------------------------------------------------------------------------------------

                'charts
                '------------------------------------------------------------------------------------
                Dim height As Integer = xSheet.Range("A1").Resize(4 + ds.Tables(i).Rows.Count, 1).Height
                charts = xSheet.ChartObjects.Add(0, height, 900, 350).Chart
                charts.SetSourceData(Source:=xSheet.Range("A2").Resize(ds.Tables(i).Rows.Count, 2))
                With charts
                    .HasTitle = True
                    .ChartTitle.Characters.Text = ds.Tables(i).TableName + "廠按原因縮數情況表"
                    With .ChartTitle.Font
                        .Name = "新細明體"
                        .Size = 12
                        .Strikethrough = False
                        .Superscript = False
                        .Subscript = False
                        .OutlineFont = False
                        .Shadow = False
                        .Underline = Excel.XlUnderlineStyle.xlUnderlineStyleNone
                        .ColorIndex = 5
                        .Background = Excel.Constants.xlAutomatic
                    End With
                    .Axes(Excel.XlAxisType.xlCategory, Excel.XlAxisGroup.xlPrimary).HasTitle = False
                    .Axes(Excel.XlAxisType.xlValue, Excel.XlAxisGroup.xlPrimary).HasTitle = False
                    .HasLegend = False
                    'show the data value
                    .ApplyDataLabels(AutoText:=True, LegendKey:=False, HasLeaderLines:=False, ShowSeriesName:=False, ShowCategoryName:=False, ShowValue:=True, ShowPercentage:=False, ShowBubbleSize:=False)
                    'X Coordinate
                    .Axes(Excel.XlAxisType.xlCategory).TickLabels.AutoScaleFont = True
                    With .Axes(Excel.XlAxisType.xlCategory).TickLabels.Font
                        .Name = "Arial"
                        .FontStyle = "標準"
                        .Size = 8
                        .Strikethrough = False
                        .Superscript = False
                        .Subscript = False
                        .OutlineFont = False
                        .Shadow = False
                        .Underline = Excel.XlUnderlineStyle.xlUnderlineStyleNone
                        .ColorIndex = Excel.Constants.xlAutomatic
                        .Background = Excel.Constants.xlAutomatic
                    End With
                End With
                '------------------------------------------------------------------------------------
            Next


            xApp.Range("A1").Select()
            xApp.Visible = True
            xApp.Caption = "Bogart Report"
            xApp.ActiveWindow.Caption = "Monthly Short Ship Analysis Report"
        Catch ex As Exception
            MessageBox.Show(ex.ToString)
        Finally
            xBook = Nothing
            xApp = Nothing
            Me.Cursor = Cursors.Default
        End Try
    End Sub