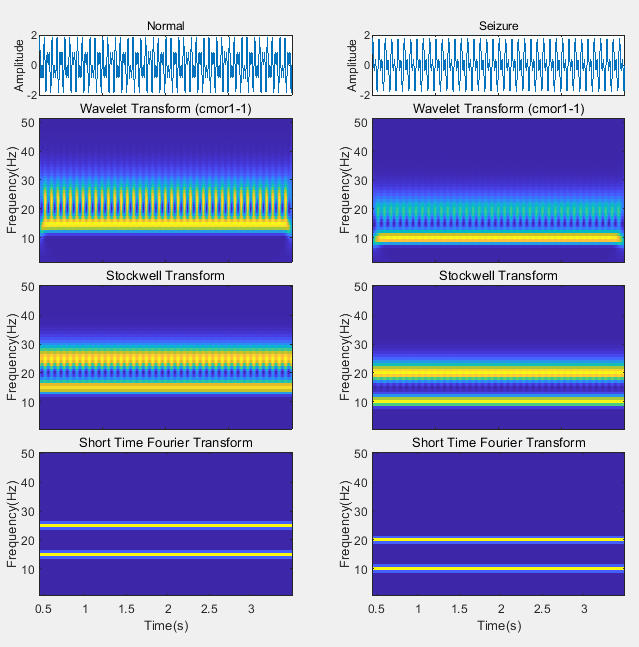
先上效果图:
Matlab框架代码:
%% Author Information
% Author: Guoyang Liu
% Email: virter1995@outlook.com
% Date: 2019-11-28 (Update 1: 2020-12-14)
% Function: Plot CWT and ST and STFT
% Others:

%% Main
clear;
ThisToolRootPath = pwd;
addpath(genpath(ThisToolRootPath));

%%%%%%%%%%%%%%%%%%%%%%%%%% Generate Signals %%%%%%%%%%%%%%%%%%%%%%%%%%
fs = 256;
f1=10;
f2=20;
f3=25;
f4=15;
t=1/fs:1/fs:4;
sig1=sin(2*pi*f1*t)+sin(2*pi*f2*t);
sig2=sin(2*pi*f3*t)+sin(2*pi*f4*t);
%%%%%%%%%%%%%%%%%%%%%%%%%%%%%%%%%%%%%%%%%%%%%%%%%%%%%%%%%%%%%%%%%%%%%%

Fs = 256;

% data_seizure = load('010403aa_0021_1.asc');
data_seizure = sig1;

% data_normal = load('010403aa_0082_1.asc');
data_normal = sig2;

selFreqRange = [1,50];
freqPrecision = 1;
waveletName = 'cmor1-1';
% waveletName = 'db4';
gaussianFactor = 1;

% data = data_seizure;

nRow = 7;
nCol = 2;
N_Fig = nRow*nCol;

%% Plot
figure;

% Plot Normal
data = data_normal;

subplot(nRow,nCol,1)
t = (0:length(data)-1)/Fs;
plot(t,data);
xlim([t(1) t(end)]);
% xlabel('Time(s)');
xticklabels([]);
ylabel('Amplitude');
title('Normal');

subplot(nRow,nCol,[3 5])
[NewData,t,f] = FeatureExtract_WaveletSingle(data,Fs,selFreqRange,freqPrecision,waveletName);
imagesc(t,(f),(NewData));
set(gca,'YDir','normal')
% xlabel('Time(s)');
ylabel('Frequency(Hz)');
title(['Wavelet Transform (' waveletName ')']);
xticklabels([]);

subplot(nRow,nCol,[7 9])
[NewData,t,f] = FeatureExtract_STransSingle(data,Fs,selFreqRange,freqPrecision,gaussianFactor);
imagesc(t,(f),(NewData));
set(gca,'YDir','normal')
% xlabel('Time(s)');
ylabel('Frequency(Hz)');
title('Stockwell Transform');
xticklabels([]);

subplot(nRow,nCol,[11 13])
opt.window = Fs;
opt.noverlap = round((Fs/10)*9);
[NewData,t,f] = FeatureExtract_STFTSingle(data,Fs,selFreqRange,opt);
imagesc(t,(f),(NewData));
set(gca,'YDir','normal')
xlabel('Time(s)');
ylabel('Frequency(Hz)');
title('Short Time Fourier Transform');

% Plot Seizure
data = data_seizure;

subplot(nRow,nCol,2)
t = (0:length(data)-1)/Fs;
plot(t,data);
xlim([t(1) t(end)]);
% xlabel('Time(s)');
ylabel('Amplitude');
title('Seizure');
xticklabels([]);

subplot(nRow,nCol,[4 6])
[NewData,t,f] = FeatureExtract_WaveletSingle(data,Fs,selFreqRange,freqPrecision,waveletName);
imagesc(t,(f),(NewData));
set(gca,'YDir','normal')
% xlabel('Time(s)');
ylabel('Frequency(Hz)');
title(['Wavelet Transform (' waveletName ')']);
xticklabels([]);

subplot(nRow,nCol,[8 10])
[NewData,t,f] = FeatureExtract_STransSingle(data,Fs,selFreqRange,freqPrecision,gaussianFactor);
imagesc(t,(f),(NewData));
set(gca,'YDir','normal')
% xlabel('Time(s)');
ylabel('Frequency(Hz)');
title('Stockwell Transform');
xticklabels([]);

subplot(nRow,nCol,[12 14])
opt.window = Fs;
opt.noverlap = round((Fs/10)*9);
[NewData,t,f] = FeatureExtract_STFTSingle(data,Fs,selFreqRange,opt);
imagesc(t,(f),(NewData));
set(gca,'YDir','normal')
xlabel('Time(s)');
ylabel('Frequency(Hz)');
title('Short Time Fourier Transform');
其中子函数代码百度云盘地址:
链接:https://pan.baidu.com/s/1jMTjoSAhmYxyLMiMkEEs7Q
提取码可联系我索要