一、基础理解
- 使用逻辑回归算法训练模型时,为模型引入多项式项,使模型生成不规则的决策边界,对非线性的数据进行分类;
- 问题:引入多项式项后,模型变的复杂,可能产生过拟合现象;
- 方案:对模型正则化处理,损失函数添加正则项(αL2),生成新的损失函数,并对新的损失函数进行优化;
- 优化新的损失函数:
- 满足了让原来的损失函数尽量的小;
- 另一方面,对于 L2 正则项(包含参数 θ 值),限制 θ 的大小;
- 引入了参数 α ,调节新的损失函数中两部分(原损失函数和 L2 正则项)的重要程度;当然也可以引入 αL1 正则项;
二、正则化的其它方式
- 新的表达正则化的方式:只是方式不同,正则化的原来一样;

- 改变了超参数的位置:α、C;
- 如果超参数 C 越大,原损失函数 J(θ) 的地位相对较重要,优化损失函数时主要集中优化 J(θ) ,使其减少到最小;
- 如果超参数 C 非常小,正则项 L2 的地位相对较重要,优化损失函数时主要集中优化 L2 ,使参数 θ 中的元素尽量的小;
- 如果想让使正则项不重要,需要增大参数 C;
- 其实在 J(θ) 前加参数 C,相当于将原来的 αL2 变为 1/αL2 ,两中方式等效;
- α、C:平衡新的损失函数中两部分的关系;
- 在逻辑回归、SVM算法中,更偏好使用 C.J(θ) + L2 的方式;scikit-learn 的逻辑回归算法中,也是使用此方式;
- 原因:使用 C.J(θ) + L2 方式时,正则项的系数为 1,也就是说优化算法模型时不得不使用正则化;
三、思考
- 多项式回归:假设在特征空间中,样本的分布规律呈多项式曲线状态,可能类似 2 次多项式曲线,也可能是 3 次多项式的曲线,也可能是 n 次多项式的曲线;
- n 次多项式曲线:y = xn + ...,最高 n 次方,还有其他很多项,x 与 y 的关系曲线;
- 疑问1:是不是二维空间的所有不规则曲线都存在一个多项式与其对应?
- 疑问2:如果样本分布规律不是多项式曲线的规律,再使用多项式回归算法,或者逻辑回归的多项式形式进行分类,是不是就不准确?
- 思考:解决具体的问题,通过可视化查看样本相根据特征大致的分布,再判断可以使用哪些算法,组个尝试,找个最合适的一个;
- 最合适:准确度高、效率高;
四、实例scikit-learn中的逻辑回归算法
- scikit-learn中的逻辑回归算法自动封装了模型的正则化的功能,只需要调整 C 和 penalty;
- 主要参数:degree、C、penalty;(还有其它参数)
1)直接使用逻辑回归算法
-
import numpy as np
import matplotlib.pyplot as plt

np.random.seed(666)
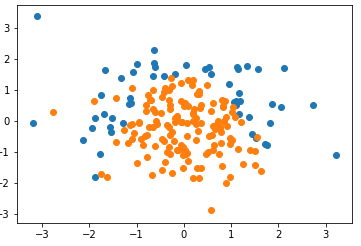
X = np.random.normal(0, 1, size=(200, 2))
y = np.array(X[:,0]**2 + X[:,1] < 1.5,dtype='int')

# 随机抽取 20 个样本,让其分类为 1,相当于认为更改数据,添加噪音
for _ in range(20):
    y[np.random.randint(200)] = 1

plt.scatter(X[y==0,0], X[y==0,1])
plt.scatter(X[y==1,0], X[y==1,1])
plt.show()

- 为虚拟的测试数据设置种子 666:则每次执行 np.random.normal(0, 1, size=(200, 2)) 时,随机生成的 X 不变;
- 随机生成数据是系统内定的,随机种子是系统随机生成数据时的依据,只要设定的随机种子相同,所有人生成的数据一样;(待考察)
-
from sklearn.model_selection import train_test_split

X_train, X_test, y_train, y_test = train_test_split(X, y, random_state=666)

from sklearn.linear_model import LogisticRegression

log_reg = LogisticRegression()
log_reg.fit(X_train, y_train)
# LogisticRegression(C=1.0, class_weight=None, dual=False, fit_intercept=True,
          intercept_scaling=1, max_iter=100, multi_class='ovr', n_jobs=1,
          penalty='l2', random_state=None, solver='liblinear', tol=0.0001,
          verbose=0, warm_start=False)
-
C=1.0:默认超参数 C 的值为1.0;
- penalty='l2':默认使用 L2 正则项;
-
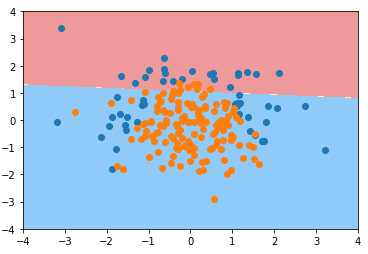
def plot_decision_boundary(model, axis):

    x0, x1 = np.meshgrid(
        np.linspace(axis[0], axis[1], int((axis[1]-axis[0])*100)).reshape(-1,1),
        np.linspace(axis[2], axis[3], int((axis[3]-axis[2])*100)).reshape(-1,1)
    )
    X_new = np.c_[x0.ravel(), x1.ravel()]

    y_predict = model.predict(X_new)
    zz = y_predict.reshape(x0.shape)

    from matplotlib.colors import ListedColormap
    custom_cmap = ListedColormap(['#EF9A9A','#FFF59D','#90CAF9'])

    plt.contourf(x0, x1, zz, linewidth=5, cmap=custom_cmap)

plot_decision_boundary(log_reg, axis=[-4, 4, -4, 4])
plt.scatter(X[y==0,0], X[y==0,1])
plt.scatter(X[y==1,0], X[y==1,1])
plt.show()

2)为逻辑回归算法的模型添加多项式项
-
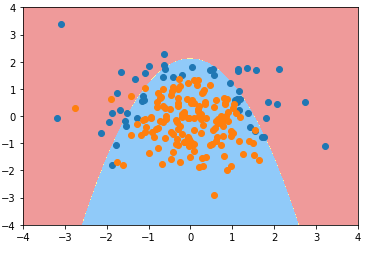
degree = 2、C 默认1.0
from sklearn.pipeline import Pipeline
from sklearn.preprocessing import PolynomialFeatures
from sklearn.preprocessing import StandardScaler

def PolynomialLogisticRegression(degree):
    return Pipeline([
        ('poly', PolynomialFeatures(degree=degree)),
        ('std_scaler', StandardScaler()),
        ('log_reg', LogisticRegression())
    ])

# 使用管道时,先生成实例的管道对象,在进行 fit;
poly_log_reg = PolynomialLogisticRegression(degree=2)
poly_log_reg.fit(X_train, y_train)

plot_decision_boundary(poly_log_reg, axis=[-4, 4, -4, 4])
plt.scatter(X[y==0,0], X[y==0,1])
plt.scatter(X[y==1,0], X[y==1,1])
plt.show()

-
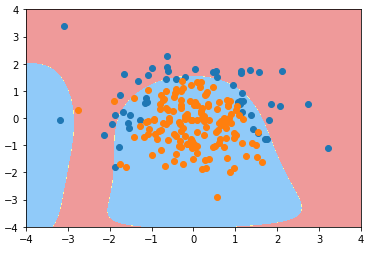
degree = 20、C 默认1.0
poly_log_reg2 = PolynomialLogisticRegression(degree=20)
poly_log_reg2.fit(X_train, y_train)

plot_decision_boundary(poly_log_reg2, axis=[-4, 4, -4, 4])
plt.scatter(X[y==0,0], X[y==0,1])
plt.scatter(X[y==1,0], X[y==1,1])
plt.show()

-
degree = 20、C = 0.1
def PolynomialLogisticRegression(degree, C):
    return Pipeline([
        ('poly', PolynomialFeatures(degree=degree)),
        ('std_scaler', StandardScaler()),
        ('log_reg', LogisticRegression(C=C))
    ])

poly_log_reg3 = PolynomialLogisticRegression(degree=20, C=0.1)
poly_log_reg3.fit(X_train, y_train)

plot_decision_boundary(poly_log_reg3, axis=[-4, 4, -4, 4])
plt.scatter(X[y==0,0], X[y==0,1])
plt.scatter(X[y==1,0], X[y==1,1])
plt.show()

-
degree = 20、C = 0.1、penalty = 'L1'(penalty:正则项类型, 默认为 L2)
def PolynomialLogisticRegression(degree, C, penalty='l2'):
    return Pipeline([
        ('poly', PolynomialFeatures(degree=degree)),
        ('std_scaler', StandardScaler()),
        ('log_reg', LogisticRegression(C=C, penalty=penalty))
    ])

poly_log_reg4 = PolynomialLogisticRegression(degree=20, C=0.1, penalty='l1')
poly_log_reg4.fit(X_train, y_train)

plot_decision_boundary(poly_log_reg4, axis=[-4, 4, -4, 4])
plt.scatter(X[y==0,0], X[y==0,1])
plt.scatter(X[y==1,0], X[y==1,1])
plt.show()

- 分析:degree = 20,模型的决策边界太复杂,模型可能过拟合,使用 L1 正则项进行模型的正则化;
- 分析2:模型过拟合后,有很多多项式项,使用 L1 正则项,使得这些多项式项的系数为 0,进而使模型决策边界更加规则,不会弯弯曲曲,便于可视化;