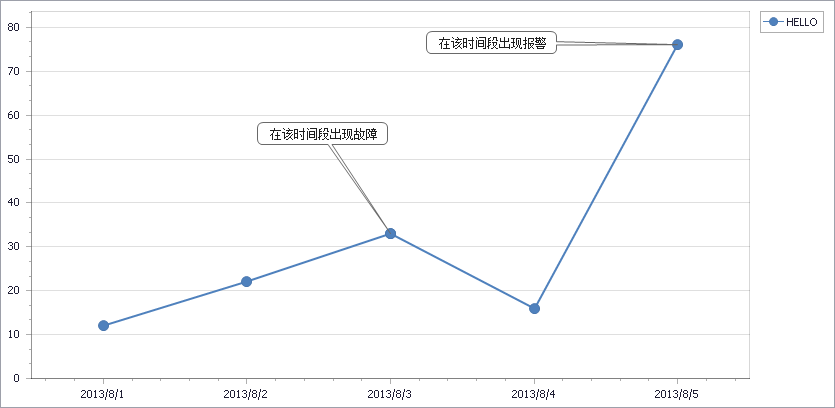
      private void BindData()
        {
            chartControl1.AnnotationRepository.Clear();
            chartControl1.Series.Clear();
            TextAnnotation text1 = new TextAnnotation();
            TextAnnotation text2 = new TextAnnotation();
            PaneAnchorPoint panel1 = new PaneAnchorPoint();
            PaneAnchorPoint panel2 = new PaneAnchorPoint();
            RelativePosition relPos1 = new RelativePosition();
            relPos1.Angle = 50;
            Series series1 = new Series("HELLO",ViewType.Line);

            foreach (var item in GetDate())
            {
                if (item.v1 == 33)
                {
                    series1.Points.Add(new SeriesPoint(item.d1, item.v1));
                    RelativePosition re = new RelativePosition();
                    re.Angle = 53;
                    TextAnnotation vs = new TextAnnotation();
                    vs.Lines = new string[] { "在该时间段出现故障" };
                    vs.RuntimeMoving = true;
                    PaneAnchorPoint panes = new PaneAnchorPoint();
                    panes.AxisXCoordinate.AxisValueSerializable = item.d1.ToString();
                    panes.AxisYCoordinate.AxisValueSerializable = item.v1.ToString();
                    vs.AnchorPoint = panes;
                    vs.ShapePosition = re;
                    this.chartControl1.AnnotationRepository.Add(vs);
                }

                if (item.v1 > 60)
                {
                    series1.Points.Add(new SeriesPoint(item.d1, item.v1));
                    TextAnnotation vs = new TextAnnotation();
                    vs.Lines=new string[]{"在该时间段出现报警"} ;
                    vs.RuntimeMoving = true;
                    PaneAnchorPoint panes = new PaneAnchorPoint();
                    panes.AxisXCoordinate.AxisValueSerializable = item.d1.ToString();
                    panes.AxisYCoordinate.AxisValueSerializable = item.v1.ToString();
                    vs.AnchorPoint = panes;
                    vs.ShapePosition = relPos1;
                    this.chartControl1.AnnotationRepository.Add(vs);
                }
                else
                {
                    series1.Points.Add(new SeriesPoint(item.d1, item.v1));
                }

            }
            //panel1.AxisXCoordinate.AxisValueSerializable = DateTime.Now.AddDays(-1).ToString();
            //panel1.AxisYCoordinate.AxisValueSerializable = "22";
            //text1.AnchorPoint = panel1;
            //text1.Name = "Text Annotation 1";
            //text1.Lines = new string[] {"A曲线"};
            //relPos1.Angle = -228.15794479643927;
            //relPos1.ConnectorLength = 102.68641584941993;
            //text1.ShapePosition = relPos1;


            //panel2.AxisXCoordinate.AxisValueSerializable = DateTime.Now.AddDays(-2).ToString();
            //panel2.AxisYCoordinate.AxisValueSerializable = "16";
            //text2.AnchorPoint = panel2;
            //text2.Name = "Text Annotation 1";
            //text2.Lines = new string[] { "B曲线" };
            //relPos1.Angle = -228.15794479643927;
            //relPos1.ConnectorLength = 202.68641584941993;
            //text2.ShapePosition = relPos1;
            //this.chartControl1.AnnotationRepository.AddRange(new DevExpress.XtraCharts.Annotation[] {
            //text2,text1});
            chartControl1.Series.Add(series1);
        }

        private List<lx> GetDate()
        {
            List<lx> ls = new List<lx>();
            ls.Add(new lx() { d1 = DateTime.Now.AddDays(-5), v1 = 12 });
            ls.Add(new lx() { d1 = DateTime.Now.AddDays(-4), v1 = 22 });
            ls.Add(new lx() { d1 = DateTime.Now.AddDays(-3), v1 = 33 });
            ls.Add(new lx() { d1 = DateTime.Now.AddDays(-2), v1 = 16 });
            ls.Add(new lx() { d1 = DateTime.Now.AddDays(-1), v1 = 76 });
            return ls;
        }
