进程管理工具uptime,top,htop
一uptime
显示当前时间,系统已启动的时间、当前上线人数,系统平均负载(1、5、10分钟的平均负载,一般不会超过1)
系统平均负载:指在特定时间间隔内运行队列中的平均进程数
通常每个CPU内核的当前活动进程数不大于3,那么系统的性能良好。
如果每个CPU内核的任务数大于5,那么此主机的性能有严重问题
如果linux主机是1个双核CPU,当Load Average 为6的时候说明机器已经被充分使用
[root@centos72 ~]# uptime
 21:58:57 up 21:30,  2 users,  load average: 0.00, 0.01, 0.05
因为开启了两个终端也就显示了两个用户
[root@centos72 ~]# who
root     pts/2        2019-05-18 00:39 (192.168.137.1)
root     pts/3        2019-05-18 00:49 (192.168.137.1)
[root@centos72 ~]# whoami
root
[root@centos72 ~]# !dd
dd  if=/dev/zero   of=/dev/null   bs=1G
[root@centos72 ~]# uptime
 22:01:31 up 21:33,  2 users,  load average: 1.07, 0.26, 0.12
[root@centos72 ~]# uptime
 22:01:42 up 21:33,  2 users,  load average: 1.22, 0.31, 0.14
[root@centos72 ~]# uptime
 22:01:51 up 21:33,  2 users,  load average: 1.26, 0.35, 0.16
[root@centos72 ~]# uptime
 22:02:05 up 21:33,  2 users,  load average: 1.42, 0.43, 0.19
[root@centos72 ~]# uptime
查看CPU内核数量
如果负载高于CPU内核数压力就很大了
使用云可以解决 CPU负载不同问题,因为有的CPU很忙,有的CPU没事干
[root@centos72 ~]# lscpu
Architecture:          x86_64
CPU op-mode(s):        32-bit, 64-bit
Byte Order:            Little Endian
CPU(s):                2
On-line CPU(s) list:   0,1
Thread(s) per core:    1
Core(s) per socket:    1
Socket(s):             2
NUMA node(s):          1
Vendor ID:             GenuineIntel
CPU family:            6
Model:                 142
Model name:            Intel(R) Core(TM) i7-7500U CPU @ 2.70GHz
Stepping:              9
CPU MHz:               2904.004
BogoMIPS:              5808.00
Hypervisor vendor:     VMware
Virtualization type:   full
L1d cache:             32K
L1i cache:             32K
L2 cache:              256K
L3 cache:              4096K
NUMA node0 CPU(s):     0,1
Flags:                 fpu vme de pse tsc msr pae mce cx8 apic sep mtrr pge mca cmov pat pse36 clflush mmx fxsr sse sse2 ss syscall nx pdpe1gb rdtscp lm constant_tsc arch_perfmon nopl xtopology tsc_reliable nonstop_tsc eagerfpu pni pclmulqdq ssse3 fma cx16 pcid sse4_1 sse4_2 x2apic movbe popcnt tsc_deadline_timer aes xsave avx f16c rdrand hypervisor lahf_lm abm 3dnowprefetch fsgsbase tsc_adjust bmi1 avx2 smep bmi2 invpcid rdseed adx smap xsaveopt arat
二进程管理工具 top
排序:
P:以占据的CPU百分比,%CPU
M:占据内存百分比,%MEM
T:累积占据CPU时长,TIME+
首部信息显示:
uptime信息:l命令
tasks及cpu信息:t命令
cpu分别显示:1 (数字)
memory信息:m命令
退出命令:q
修改刷新时间间隔:s
终止指定进程:k
保存文件:W
ps显示的是当前进程的快照,也就是看到瞬间的状态
top比ps显示的信息更加详细
(一)top显示结果说明
第一行,任务队列信息,同uptime命令的执行结果。
当前系统时间。
up xxx表示系统已经运行了多长时间
2users当前有2个用户登录系统。
load average:load average后面的三个数分别是1分钟、5分钟、15分钟的平均负载情况。
第二行,Tasks为任务(进程)
分别表示系统进程总数,处于运行状态,休眠(sleep)状态,stoped状态,zombie僵死状态
第三行,CPU状态的相关信息
0.0%us用户空间占用CPU的百分比。
0.0%sy内核空间占用CPU的百分比。
0.0%ni改变过优先级的进程占用CPU的百分比。
100.0%id空闲CPU百分比。
0.0%waI/o等待占用CPU的百分比。
0.0%hi硬中断(HardwareIRQ)占用CPU的百分比。
0.0%si软中断(Software Interrupts)占用CPU的百分比。
0.0%st虚拟机占用CPU的百分比。
第四行,内存状态
从左到右分别是total物理内存总量,free空闲内存总量,used使用中的内存总量,buffers 缓冲的内存量。
第五行,swap交换分区信息
从左到右分别是total交换区总量,free空闲交换区总量,used使用的交换区总量, avail Mem 可用的内存量。
目前是系统资源占用的多,因为I/O和内核级有关,用户空间占用的资源更少
栏位信息简介
us:用户空间
sy:内核空间
ni:调整nice时间
id:空闲
wa:等待IO时间
hi:硬中断
si:软中断(模式切换)
st:虚拟机偷走的时间,比如windows上面运行了linux虚拟机,占用了CPU
因为Linux里面没有虚拟机就显示为0
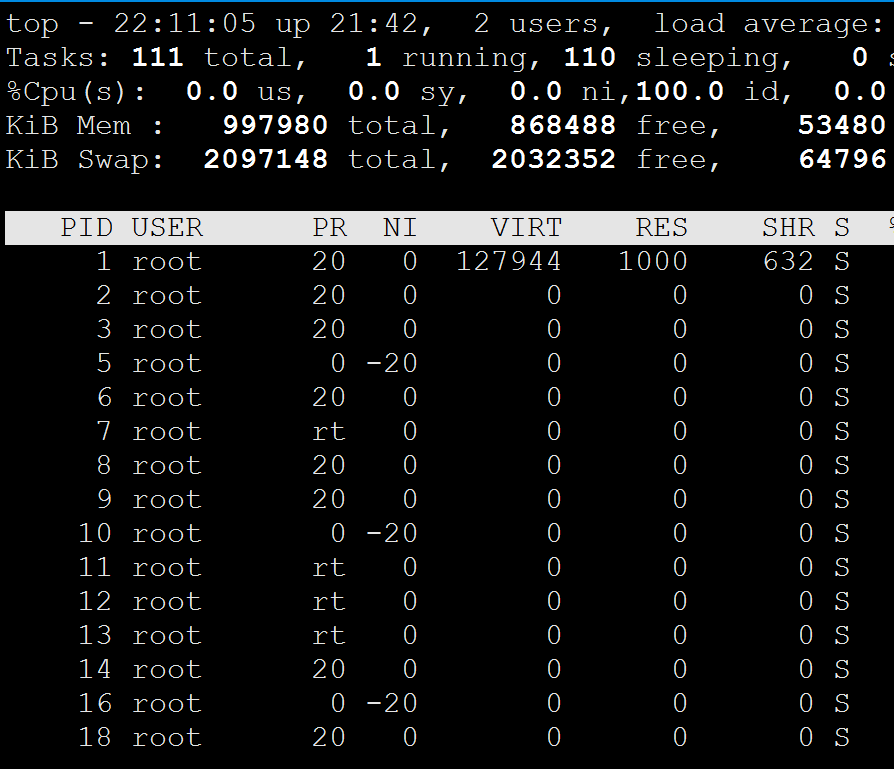
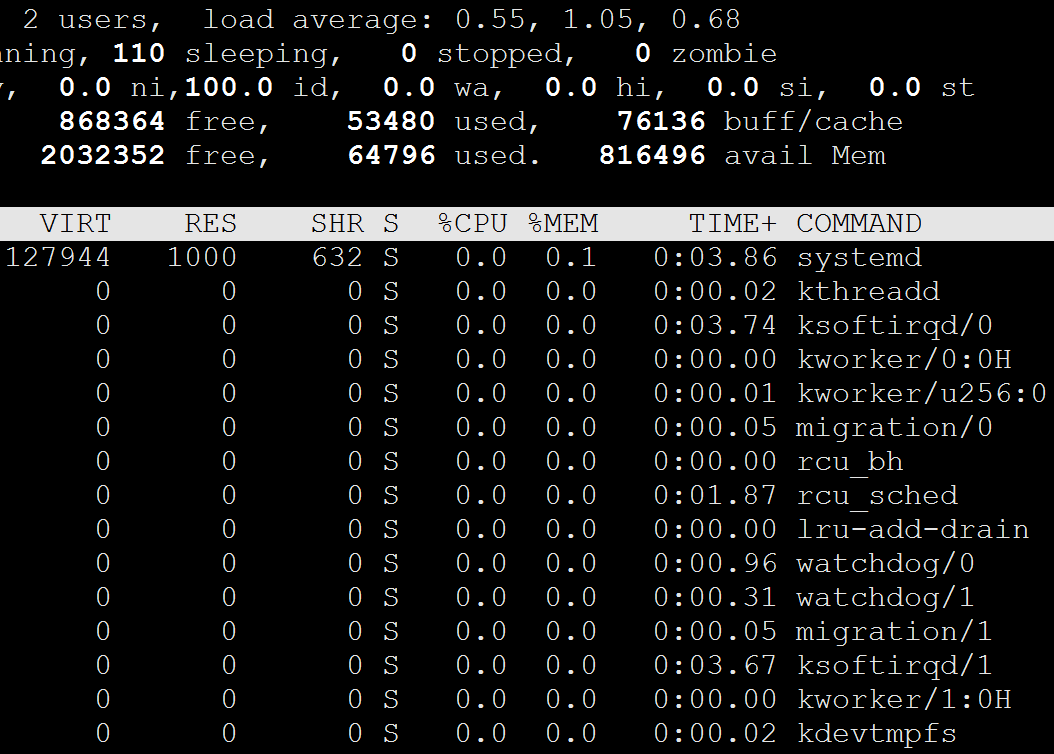
[root@centos72 ~]# top
top - 22:13:23 up 21:45,  2 users,  load average: 0.09, 0.72, 0.61
Tasks: 111 total,   2 running, 109 sleeping,   0 stopped,   0 zombie
%Cpu(s):  0.0 us,  0.0 sy,  0.0 ni,100.0 id,  0.0 wa,  0.0 hi,  0.0 si,  0.0 st
KiB Mem :   997980 total,   868364 free,    53480 used,    76136 buff/cache
KiB Swap:  2097148 total,  2032352 free,    64796 used.   816496 avail Mem

   PID USER      PR  NI    VIRT    RES    SHR S  %CPU %MEM     TIME+ COMMAND
  4107 root      20   0  161840   2184   1540 R   0.3  0.2   0:00.17 top
     1 root      20   0  127944   1000    632 S   0.0  0.1   0:03.86 systemd
     2 root      20   0       0      0      0 S   0.0  0.0   0:00.02 kthreadd
     3 root      20   0       0      0      0 S   0.0  0.0   0:03.74 ksoftirqd/0
     5 root       0 -20       0      0      0 S   0.0  0.0   0:00.00 kworker/0:0H
     6 root      20   0       0      0      0 S   0.0  0.0   0:00.01 kworker/u256:0
     7 root      rt   0       0      0      0 S   0.0  0.0   0:00.05 migration/0
     8 root      20   0       0      0      0 S   0.0  0.0   0:00.00 rcu_bh
     9 root      20   0       0      0      0 S   0.0  0.0   0:01.88 rcu_sched
    10 root       0 -20       0      0      0 S   0.0  0.0   0:00.00 lru-add-drain
    11 root      rt   0       0      0      0 S   0.0  0.0   0:00.96 watchdog/0
    12 root      rt   0       0      0      0 S   0.0  0.0   0:00.31 watchdog/1
    13 root      rt   0       0      0      0 S   0.0  0.0   0:00.05 migration/1
    14 root      20   0       0      0      0 S   0.0  0.0   0:03.67 ksoftirqd/1
    16 root       0 -20       0      0      0 S   0.0  0.0   0:00.00 kworker/1:0H
CPU马上就达到了100%了,因为有两颗CPU,所以可以允许两个进程CPU利用率达到100%
[root@centos72 ~]# dd if=/dev/zero of=/dev/null
[root@centos72 ~]# top
top - 22:34:21 up 22:06,  2 users,  load average: 1.19, 0.39, 0.29
Tasks: 111 total,   2 running, 109 sleeping,   0 stopped,   0 zombie
%Cpu(s): 14.0 us, 35.9 sy,  0.0 ni, 50.1 id,  0.0 wa,  0.0 hi,  0.0 si,  0.0 st
KiB Mem :   997980 total,   871880 free,    53112 used,    72988 buff/cache
KiB Swap:  2097148 total,  2032988 free,    64160 used.   818420 avail Mem

   PID USER      PR  NI    VIRT    RES    SHR S  %CPU %MEM     TIME+ COMMAND
  4114 root      20   0  107992    612    512 R 100.0  0.1   0:12.55 dd
     1 root      20   0  127944    992    624 S   0.0  0.1   0:03.91 systemd
     2 root      20   0       0      0      0 S   0.0  0.0   0:00.02 kthreadd
     3 root      20   0       0      0      0 S   0.0  0.0   0:03.75 ksoftirqd/0
     5 root       0 -20       0      0      0 S   0.0  0.0   0:00.00 kworker/0:0H
     6 root      20   0       0      0      0 S   0.0  0.0   0:00.01 kworker/u256:0
     7 root      rt   0       0      0      0 S   0.0  0.0   0:00.05 migration/0
     8 root      20   0       0      0      0 S   0.0  0.0   0:00.00 rcu_bh
     9 root      20   0       0      0      0 S   0.0  0.0   0:01.92 rcu_sched
    10 root       0 -20       0      0      0 S   0.0  0.0   0:00.00 lru-add-drain
    11 root      rt   0       0      0      0 S   0.0  0.0   0:00.96 watchdog/0
    12 root      rt   0       0      0      0 S   0.0  0.0   0:00.31 watchdog/1
    13 root      rt   0       0      0      0 S   0.0  0.0   0:00.05 migration/1
    14 root      20   0       0      0      0 S   0.0  0.0   0:03.67 ksoftirqd/1
    16 root       0 -20       0      0      0 S   0.0  0.0   0:00.00 kworker/1:0H
再开启一个终端,两个进程的CPU利用率马上就达到了100%
[root@centos72 ~]# top
top - 22:36:19 up 22:08,  3 users,  load average: 1.51, 0.68, 0.40
Tasks: 115 total,   3 running, 112 sleeping,   0 stopped,   0 zombie
%Cpu(s): 28.0 us, 72.0 sy,  0.0 ni,  0.0 id,  0.0 wa,  0.0 hi,  0.0 si,  0.0 st
KiB Mem :   997980 total,   846020 free,    61636 used,    90324 buff/cache
KiB Swap:  2097148 total,  2034780 free,    62368 used.   800860 avail Mem

   PID USER      PR  NI    VIRT    RES    SHR S  %CPU %MEM     TIME+ COMMAND
  4114 root      20   0  107992    612    512 R  99.7  0.1   2:09.75 dd
  4139 root      20   0  107992    612    512 R  99.3  0.1   0:15.79 dd
   287 root      20   0       0      0      0 S   0.3  0.0   0:00.53 xfsaild/sda2
   546 root      20   0  298712   1492   1156 S   0.3  0.1   0:56.53 vmtoolsd
     1 root      20   0  127944   3148   2068 S   0.0  0.3   0:03.93 systemd
     2 root      20   0       0      0      0 S   0.0  0.0   0:00.02 kthreadd
     3 root      20   0       0      0      0 S   0.0  0.0   0:03.75 ksoftirqd/0
     5 root       0 -20       0      0      0 S   0.0  0.0   0:00.00 kworker/0:0H
     6 root      20   0       0      0      0 S   0.0  0.0   0:00.01 kworker/u256:0
     7 root      rt   0       0      0      0 S   0.0  0.0   0:00.05 migration/0
     8 root      20   0       0      0      0 S   0.0  0.0   0:00.00 rcu_bh
     9 root      20   0       0      0      0 S   0.0  0.0   0:01.95 rcu_sched
    10 root       0 -20       0      0      0 S   0.0  0.0   0:00.00 lru-add-drain
    11 root      rt   0       0      0      0 S   0.0  0.0   0:00.96 watchdog/0
    12 root      rt   0       0      0      0 S   0.0  0.0   0:00.31 watchdog/1
因为有两颗内核
[root@centos72 ~]# lscpu
Architecture:          x86_64
CPU op-mode(s):        32-bit, 64-bit
Byte Order:            Little Endian
CPU(s):                2
On-line CPU(s) list:   0,1
Thread(s) per core:    1
Core(s) per socket:    1
Socket(s):             2
NUMA node(s):          1
Vendor ID:             GenuineIntel
CPU family:            6
Model:                 142
Model name:            Intel(R) Core(TM) i7-7500U CPU @ 2.70GHz
Stepping:              9
CPU MHz:               2904.004
BogoMIPS:              5808.00
Hypervisor vendor:     VMware
Virtualization type:   full
L1d cache:             32K
L1i cache:             32K
L2 cache:              256K
L3 cache:              4096K
NUMA node0 CPU(s):     0,1
Flags:                 fpu vme de pse tsc msr pae mce cx8 apic sep mtrr pge mca cmov pat pse36 clflush mmx fxsr sse sse2 ss syscall nx pdpe1gb rdtscp lm constant_tsc arch_perfmon nopl xtopology tsc_reliable nonstop_tsc eagerfpu pni pclmulqdq ssse3 fma cx16 pcid sse4_1 sse4_2 x2apic movbe popcnt tsc_deadline_timer aes xsave avx f16c rdrand hypervisor lahf_lm abm 3dnowprefetch fsgsbase tsc_adjust bmi1 avx2 smep bmi2 invpcid rdseed adx smap xsaveopt arat
默认是按照CPU排序的,如果是按照内存排序,那么在执行了命令top之后就按M即可
top - 22:41:24 up 22:13,  3 users,  load average: 0.92, 0.97, 0.63
Tasks: 114 total,   2 running, 112 sleeping,   0 stopped,   0 zombie
%Cpu(s): 14.5 us, 35.2 sy,  0.0 ni, 50.3 id,  0.0 wa,  0.0 hi,  0.0 si,  0.0 st
KiB Mem :   997980 total,   845064 free,    62044 used,    90872 buff/cache
KiB Swap:  2097148 total,  2034780 free,    62368 used.   800188 avail Mem

   PID USER      PR  NI    VIRT    RES    SHR S  %CPU %MEM     TIME+ COMMAND
  4115 root      20   0  154588   5392   4068 S   0.0  0.5   0:00.30 sshd
     1 root      20   0  127944   3148   2068 S   0.0  0.3   0:03.94 systemd
  4120 root      20   0  115932   2508   1656 S   0.0  0.3   0:00.03 bash
  4143 root      20   0  161940   2188   1540 R   0.3  0.2   0:00.10 top
  2114 root      20   0  116032   1524    828 S   0.0  0.2   0:00.10 bash
   546 root      20   0  298712   1492   1156 S   0.3  0.1   0:57.42 vmtoolsd
   357 root      20   0   37124   1288   1160 S   0.0  0.1   0:00.79 systemd-journal
  2057 root      20   0  116036   1272    732 S   0.0  0.1   0:00.55 bash
   544 root      20   0  476268   1212    716 S   0.0  0.1   0:06.47 NetworkManager
   548 root      20   0   26376    940    780 S   0.0  0.1   0:00.69 systemd-logind
   540 dbus      20   0   66428    920    600 S   0.0  0.1   0:01.73 dbus-daemon
   787 root      20   0  214424    912    536 S   0.0  0.1   0:03.11 rsyslogd
   539 polkitd   20   0  538536    800    552 S   0.0  0.1   0:00.12 polkitd
  4139 root      20   0  107992    612    512 R 100.0  0.1   5:20.34 dd
   784 root      20   0  573856    528    224 S   0.0  0.1   0:07.99 tuned
(二)top排序
T:累积占据CPU时长,TIME+
如果是按照总的占据CPU时间排序,那么在执行了命令top之后就按T即可
top - 22:43:41 up 22:15,  3 users,  load average: 0.92, 0.93, 0.66
Tasks: 114 total,   2 running, 112 sleeping,   0 stopped,   0 zombie
%Cpu(s): 15.1 us, 34.9 sy,  0.0 ni, 49.9 id,  0.0 wa,  0.0 hi,  0.0 si,  0.0 st
KiB Mem :   997980 total,   845064 free,    62044 used,    90872 buff/cache
KiB Swap:  2097148 total,  2034780 free,    62368 used.   800188 avail Mem

   PID USER      PR  NI    VIRT    RES    SHR S  %CPU %MEM     TIME+ COMMAND
  4139 root      20   0  107992    612    512 R 100.0  0.1   7:37.19 dd
   546 root      20   0  298712   1492   1156 S   0.0  0.1   0:57.57 vmtoolsd
    32 root      20   0       0      0      0 S   0.0  0.0   0:25.70 kswapd0
   784 root      20   0  573856    528    224 S   0.0  0.1   0:08.00 tuned
   544 root      20   0  476268   1212    716 S   0.0  0.1   0:06.48 NetworkManager
   538 root      20   0   21668    360    240 S   0.0  0.0   0:06.11 irqbalance
     1 root      20   0  127944   3148   2068 S   0.0  0.3   0:03.94 systemd
  2295 root      20   0  230376    200    132 S   0.0  0.0   0:03.83 httpd
     3 root      20   0       0      0      0 S   0.0  0.0   0:03.75 ksoftirqd/0
    14 root      20   0       0      0      0 S   0.0  0.0   0:03.67 ksoftirqd/1
   787 root      20   0  214424    912    536 S   0.0  0.1   0:03.12 rsyslogd
     9 root      20   0       0      0      0 S   0.0  0.0   0:02.01 rcu_sched
   540 dbus      20   0   66428    920    600 S   0.0  0.1   0:01.74 dbus-daemon
   247 root      20   0       0      0      0 S   0.0  0.0   0:01.64 kworker/u256:2
  3967 root      20   0       0      0      0 S   0.0  0.0   0:01.62 kworker/1:0
(三)首部信息显示与否
(1)uptime信息不显示在执行了top命令之后按l即可
Tasks: 113 total,   2 running, 111 sleeping,   0 stopped,   0 zombie
%Cpu(s): 14.7 us, 34.8 sy,  0.0 ni, 50.5 id,  0.0 wa,  0.0 hi,  0.0 si,  0.0 st
KiB Mem :   997980 total,   845080 free,    62028 used,    90872 buff/cache
KiB Swap:  2097148 total,  2034780 free,    62368 used.   800204 avail Mem

   PID USER      PR  NI    VIRT    RES    SHR S  %CPU %MEM     TIME+ COMMAND
  4139 root      20   0  107992    612    512 R  99.7  0.1  10:08.53 dd
   546 root      20   0  298712   1492   1156 S   0.7  0.1   0:57.74 vmtoolsd
    32 root      20   0       0      0      0 S   0.0  0.0   0:25.70 kswapd0
   784 root      20   0  573856    528    224 S   0.0  0.1   0:08.02 tuned
   544 root      20   0  476268   1212    716 S   0.0  0.1   0:06.48 NetworkManager
   538 root      20   0   21668    360    240 S   0.0  0.0   0:06.12 irqbalance
     1 root      20   0  127944   3148   2068 S   0.0  0.3   0:03.95 systemd
  2295 root      20   0  230376    200    132 S   0.0  0.0   0:03.84 httpd
     3 root      20   0       0      0      0 S   0.0  0.0   0:03.75 ksoftirqd/0
    14 root      20   0       0      0      0 S   0.0  0.0   0:03.67 ksoftirqd/1
   787 root      20   0  214424    912    536 S   0.0  0.1   0:03.12 rsyslogd
     9 root      20   0       0      0      0 S   0.0  0.0   0:02.03 rcu_sched
   540 dbus      20   0   66428    920    600 S   0.0  0.1   0:01.74 dbus-daemon
   247 root      20   0       0      0      0 S   0.0  0.0   0:01.64 kworker/u256:2
  3967 root      20   0       0      0      0 S   0.0  0.0   0:01.64 kworker/1:0
   388 root      20   0   48756      8      8 S   0.0  0.0   0:01.14 systemd-udevd
(2)tasks及cpu信息:t命令
可以以进度条或者栅栏的方式显示,也可以隐藏起来
KiB Mem :   997980 total,   845080 free,    62028 used,    90872 buff/cache
KiB Swap:  2097148 total,  2034780 free,    62368 used.   800204 avail Mem

   PID USER      PR  NI    VIRT    RES    SHR S  %CPU %MEM     TIME+ COMMAND
  4139 root      20   0  107992    612    512 R  99.7  0.1  11:56.60 dd
   546 root      20   0  298712   1492   1156 S   0.3  0.1   0:57.82 vmtoolsd
    32 root      20   0       0      0      0 S   0.0  0.0   0:25.70 kswapd0
   784 root      20   0  573856    528    224 S   0.0  0.1   0:08.03 tuned
   544 root      20   0  476268   1212    716 S   0.0  0.1   0:06.48 NetworkManager
   538 root      20   0   21668    360    240 S   0.0  0.0   0:06.13 irqbalance
     1 root      20   0  127944   3148   2068 S   0.0  0.3   0:03.95 systemd
  2295 root      20   0  230376    200    132 S   0.0  0.0   0:03.84 httpd
     3 root      20   0       0      0      0 S   0.0  0.0   0:03.75 ksoftirqd/0
    14 root      20   0       0      0      0 S   0.0  0.0   0:03.67 ksoftirqd/1
   787 root      20   0  214424    912    536 S   0.0  0.1   0:03.13 rsyslogd
     9 root      20   0       0      0      0 S   0.3  0.0   0:02.05 rcu_sched
   540 dbus      20   0   66428    920    600 S   0.0  0.1   0:01.74 dbus-daemon
   247 root      20   0       0      0      0 S   0.0  0.0   0:01.65 kworker/u256:2
  3967 root      20   0       0      0      0 S   0.0  0.0   0:01.64 kworker/1:0
   388 root      20   0   48756      8      8 S   0.0  0.0   0:01.14 systemd-udevd
  2053 root      20   0  154588    320    140 S   0.0  0.0   0:01.14 sshd
    11 root      rt   0       0      0      0 S   0.0  0.0   0:00.97 watchdog/0
以栅栏的方式显示
Tasks: 113 total,   3 running, 110 sleeping,   0 stopped,   0 zombie
%Cpu(s):  15.1/34.9   50[|||||||||||||||||||||||||||||||||||||||                                      ]
KiB Mem :   997980 total,   845080 free,    62028 used,    90872 buff/cache
KiB Swap:  2097148 total,  2034780 free,    62368 used.   800204 avail Mem

   PID USER      PR  NI    VIRT    RES    SHR S  %CPU %MEM     TIME+ COMMAND
  4139 root      20   0  107992    612    512 R  95.5  0.1  13:15.68 dd
   546 root      20   0  298712   1492   1156 S   0.0  0.1   0:57.90 vmtoolsd
    32 root      20   0       0      0      0 S   0.0  0.0   0:25.70 kswapd0
   784 root      20   0  573856    528    224 S   0.0  0.1   0:08.04 tuned
   544 root      20   0  476268   1212    716 S   0.0  0.1   0:06.48 NetworkManager
   538 root      20   0   21668    360    240 S   0.0  0.0   0:06.13 irqbalance
     1 root      20   0  127944   3148   2068 S   0.0  0.3   0:03.95 systemd
  2295 root      20   0  230376    200    132 S   0.0  0.0   0:03.84 httpd
     3 root      20   0       0      0      0 S   0.0  0.0   0:03.75 ksoftirqd/0
    14 root      20   0       0      0      0 S   0.0  0.0   0:03.67 ksoftirqd/1
   787 root      20   0  214424    912    536 S   0.0  0.1   0:03.13 rsyslogd
     9 root      20   0       0      0      0 S   0.0  0.0   0:02.06 rcu_sched
   540 dbus      20   0   66428    920    600 S   0.0  0.1   0:01.74 dbus-daemon
   247 root      20   0       0      0      0 S   0.0  0.0   0:01.65 kworker/u256:2
  3967 root      20   0       0      0      0 S   0.0  0.0   0:01.65 kworker/1:0
  2053 root      20   0  154588    320    140 S   2.3  0.0   0:01.16 sshd
以进度条的方式显示
Tasks: 113 total,   3 running, 110 sleeping,   0 stopped,   0 zombie
%Cpu(s):  13.4/36.5   50[                                                                             ]
KiB Mem :   997980 total,   845080 free,    62028 used,    90872 buff/cache
KiB Swap:  2097148 total,  2034780 free,    62368 used.   800204 avail Mem

   PID USER      PR  NI    VIRT    RES    SHR S  %CPU %MEM     TIME+ COMMAND
  4139 root      20   0  107992    612    512 R 100.0  0.1  13:35.96 dd
   546 root      20   0  298712   1492   1156 S   0.0  0.1   0:57.92 vmtoolsd
    32 root      20   0       0      0      0 S   0.0  0.0   0:25.70 kswapd0
   784 root      20   0  573856    528    224 S   0.0  0.1   0:08.04 tuned
   544 root      20   0  476268   1212    716 S   0.0  0.1   0:06.48 NetworkManager
   538 root      20   0   21668    360    240 S   0.0  0.0   0:06.13 irqbalance
     1 root      20   0  127944   3148   2068 S   0.0  0.3   0:03.95 systemd
  2295 root      20   0  230376    200    132 S   0.4  0.0   0:03.85 httpd
     3 root      20   0       0      0      0 S   0.0  0.0   0:03.75 ksoftirqd/0
    14 root      20   0       0      0      0 S   0.0  0.0   0:03.67 ksoftirqd/1
   787 root      20   0  214424    912    536 S   0.0  0.1   0:03.13 rsyslogd
     9 root      20   0       0      0      0 S   0.4  0.0   0:02.07 rcu_sched
   540 dbus      20   0   66428    920    600 S   0.0  0.1   0:01.74 dbus-daemon
   247 root      20   0       0      0      0 S   0.0  0.0   0:01.65 kworker/u256:2
  3967 root      20   0       0      0      0 S   0.0  0.0   0:01.65 kworker/1:0
  2053 root      20   0  154588    320    140 S   0.0  0.0   0:01.16 sshd
(3)cpu分别显示:1 (数字)
Tasks: 113 total,   3 running, 110 sleeping,   0 stopped,   0 zombie
%Cpu(s):  13.4/36.5   50[                                                                             ]
KiB Mem :   997980 total,   845080 free,    62028 used,    90872 buff/cache
KiB Swap:  2097148 total,  2034780 free,    62368 used.   800204 avail Mem

   PID USER      PR  NI    VIRT    RES    SHR S  %CPU %MEM     TIME+ COMMAND
  4139 root      20   0  107992    612    512 R 100.0  0.1  13:35.96 dd
   546 root      20   0  298712   1492   1156 S   0.0  0.1   0:57.92 vmtoolsd
    32 root      20   0       0      0      0 S   0.0  0.0   0:25.70 kswapd0
   784 root      20   0  573856    528    224 S   0.0  0.1   0:08.04 tuned
   544 root      20   0  476268   1212    716 S   0.0  0.1   0:06.48 NetworkManager
   538 root      20   0   21668    360    240 S   0.0  0.0   0:06.13 irqbalance
     1 root      20   0  127944   3148   2068 S   0.0  0.3   0:03.95 systemd
  2295 root      20   0  230376    200    132 S   0.4  0.0   0:03.85 httpd
     3 root      20   0       0      0      0 S   0.0  0.0   0:03.75 ksoftirqd/0
    14 root      20   0       0      0      0 S   0.0  0.0   0:03.67 ksoftirqd/1
   787 root      20   0  214424    912    536 S   0.0  0.1   0:03.13 rsyslogd
     9 root      20   0       0      0      0 S   0.4  0.0   0:02.07 rcu_sched
   540 dbus      20   0   66428    920    600 S   0.0  0.1   0:01.74 dbus-daemon
   247 root      20   0       0      0      0 S   0.0  0.0   0:01.65 kworker/u256:2
  3967 root      20   0       0      0      0 S   0.0  0.0   0:01.65 kworker/1:0
  2053 root      20   0  154588    320    140 S   0.0  0.0   0:01.16 sshd
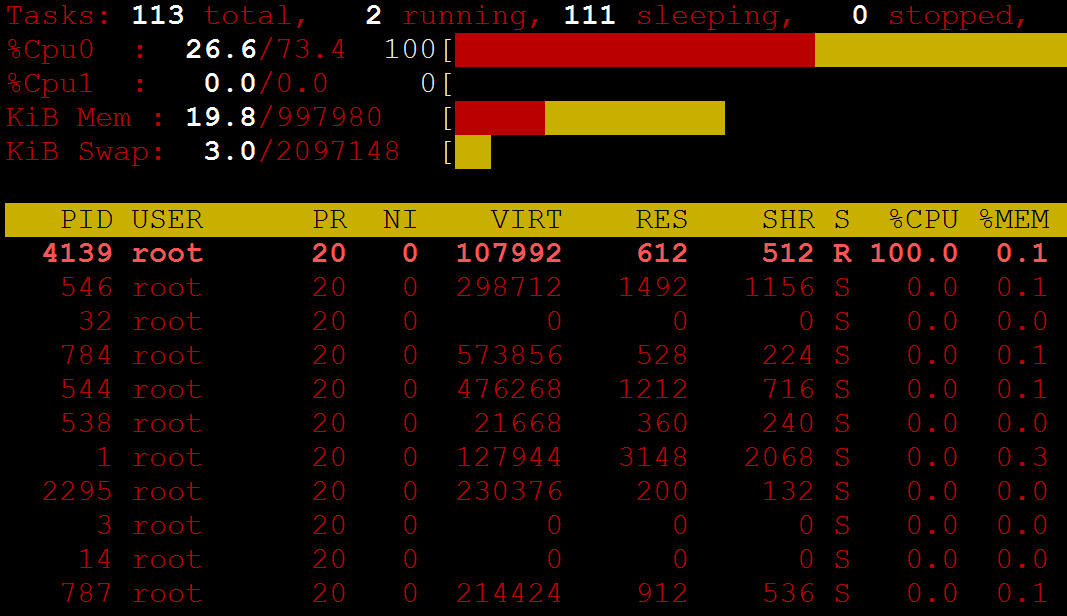
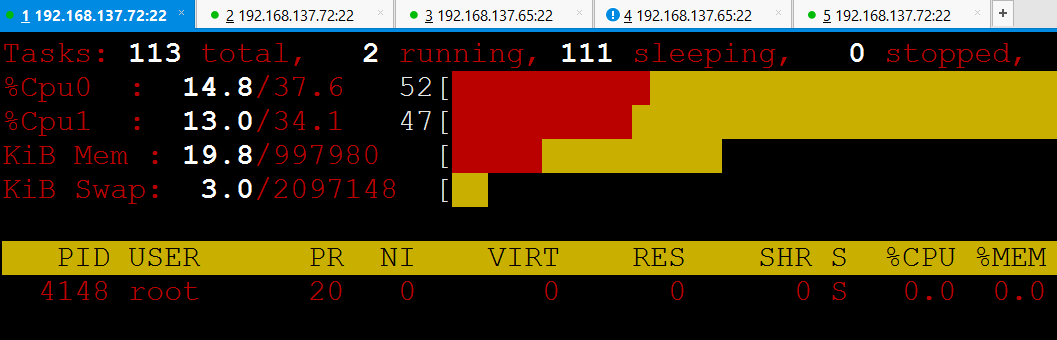
(4)memory信息:m命令
Tasks: 113 total,   2 running, 111 sleeping,   0 stopped,   0 zombie
%Cpu0  :   0.0/0.3     0[                                                                             ]
%Cpu1  :  30.0/70.0  100[                                                                             ]
KiB Mem : 19.8/997980   [|||||||||||||||                                                              ]
KiB Swap:  3.0/2097148  [||                                                                           ]

   PID USER      PR  NI    VIRT    RES    SHR S  %CPU %MEM     TIME+ COMMAND
  4139 root      20   0  107992    612    512 R 100.0  0.1  15:10.42 dd
   546 root      20   0  298712   1492   1156 S   0.7  0.1   0:57.99 vmtoolsd
    32 root      20   0       0      0      0 S   0.0  0.0   0:25.70 kswapd0
   784 root      20   0  573856    528    224 S   0.0  0.1   0:08.05 tuned
   544 root      20   0  476268   1212    716 S   0.0  0.1   0:06.48 NetworkManager
   538 root      20   0   21668    360    240 S   0.0  0.0   0:06.14 irqbalance
     1 root      20   0  127944   3148   2068 S   0.0  0.3   0:03.95 systemd
  2295 root      20   0  230376    200    132 S   0.0  0.0   0:03.86 httpd
     3 root      20   0       0      0      0 S   0.0  0.0   0:03.75 ksoftirqd/0
    14 root      20   0       0      0      0 S   0.0  0.0   0:03.67 ksoftirqd/1
   787 root      20   0  214424    912    536 S   0.0  0.1   0:03.14 rsyslogd
     9 root      20   0       0      0      0 S   0.0  0.0   0:02.08 rcu_sched
   540 dbus      20   0   66428    920    600 S   0.0  0.1   0:01.74 dbus-daemon
  3967 root      20   0       0      0      0 S   0.0  0.0   0:01.66 kworker/1:0
   247 root      20   0       0      0      0 S   0.0  0.0   0:01.65 kworker/u256:2
以进度条的方式显示
Tasks: 113 total,   2 running, 111 sleeping,   0 stopped,   0 zombie
%Cpu0  :  28.1/71.9  100[                                                                             ]
%Cpu1  :   0.0/0.0     0[                                                                             ]
KiB Mem : 19.8/997980   [                                                                             ]
KiB Swap:  3.0/2097148  [                                                                             ]

   PID USER      PR  NI    VIRT    RES    SHR S  %CPU %MEM     TIME+ COMMAND
  4139 root      20   0  107992    612    512 R 100.0  0.1  15:54.68 dd
   546 root      20   0  298712   1492   1156 S   0.0  0.1   0:58.01 vmtoolsd
    32 root      20   0       0      0      0 S   0.0  0.0   0:25.70 kswapd0
   784 root      20   0  573856    528    224 S   0.0  0.1   0:08.05 tuned
   544 root      20   0  476268   1212    716 S   0.0  0.1   0:06.48 NetworkManager
   538 root      20   0   21668    360    240 S   0.0  0.0   0:06.14 irqbalance
     1 root      20   0  127944   3148   2068 S   0.0  0.3   0:03.95 systemd
  2295 root      20   0  230376    200    132 S   0.0  0.0   0:03.86 httpd
     3 root      20   0       0      0      0 S   0.0  0.0   0:03.75 ksoftirqd/0
    14 root      20   0       0      0      0 S   0.0  0.0   0:03.67 ksoftirqd/1
   787 root      20   0  214424    912    536 S   0.0  0.1   0:03.14 rsyslogd
     9 root      20   0       0      0      0 S   0.0  0.0   0:02.08 rcu_sched
   540 dbus      20   0   66428    920    600 S   0.0  0.1   0:01.74 dbus-daemon
  3967 root      20   0       0      0      0 S   0.0  0.0   0:01.66 kworker/1:0
   247 root      20   0       0      0      0 S   0.0  0.0   0:01.65 kworker/u256:2
按z会显示颜色

在6上显示的
在7上可以往下翻,在6上不行
(四)修改刷新时间间隔:s
可以设置为1秒,回车即可
刷新间隔过于频繁不好的,增加了系统负担
top - 23:01:01 up 22:32,  3 users,  load average: 0.67, 0.77, 0.75
Tasks: 113 total,   2 running, 111 sleeping,   0 stopped,   0 zombie
%Cpu(s): 12.9 us, 38.7 sy,  0.0 ni, 48.4 id,  0.0 wa,  0.0 hi,  0.0 si,  0.0 st
KiB Mem :   997980 total,   845088 free,    62020 used,    90872 buff/cache
KiB Swap:  2097148 total,  2034780 free,    62368 used.   800212 avail Mem
Change delay from 3.0 to 1
   PID USER      PR  NI    VIRT    RES    SHR S  %CPU %MEM     TIME+ COMMAND
  4139 root      20   0  107992    612    512 R 100.0  0.1  24:56.46 dd
     1 root      20   0  127944   3148   2068 S   0.0  0.3   0:03.98 systemd
     2 root      20   0       0      0      0 S   0.0  0.0   0:00.02 kthreadd
     3 root      20   0       0      0      0 S   0.0  0.0   0:03.75 ksoftirqd/0
     5 root       0 -20       0      0      0 S   0.0  0.0   0:00.00 kworker/0:0H
     6 root      20   0       0      0      0 S   0.0  0.0   0:00.01 kworker/u256:0
     7 root      rt   0       0      0      0 S   0.0  0.0   0:00.06 migration/0
     8 root      20   0       0      0      0 S   0.0  0.0   0:00.00 rcu_bh
     9 root      20   0       0      0      0 S   0.0  0.0   0:02.24 rcu_sched
    10 root       0 -20       0      0      0 S   0.0  0.0   0:00.00 lru-add-drain
    11 root      rt   0       0      0      0 S   0.0  0.0   0:00.97 watchdog/0
    12 root      rt   0       0      0      0 S   0.0  0.0   0:00.32 watchdog/1
    13 root      rt   0       0      0      0 S   0.0  0.0   0:00.06 migration/1
    14 root      20   0       0      0      0 S   0.0  0.0   0:03.67 ksoftirqd/1
    16 root       0 -20       0      0      0 S   0.0  0.0   0:00.00 kworker/1:0H
(五)终止指定进程:k
top - 23:04:59 up 22:36,  3 users,  load average: 0.40, 0.68, 0.73
Tasks: 114 total,   3 running, 111 sleeping,   0 stopped,   0 zombie
%Cpu(s): 13.3 us, 36.7 sy,  0.0 ni, 49.8 id,  0.0 wa,  0.0 hi,  0.2 si,  0.0 st
KiB Mem :   997980 total,   843416 free,    62840 used,    91724 buff/cache
KiB Swap:  2097148 total,  2035292 free,    61856 used.   798888 avail Mem

   PID USER      PR  NI    VIRT    RES    SHR S  %CPU %MEM     TIME+ COMMAND
  4166 root      20   0  107992    612    512 R 100.0  0.1   0:20.70 dd
  4167 root      20   0  161940   2188   1540 R   0.3  0.2   0:00.01 top
     1 root      20   0  127944   3256   2092 S   0.0  0.3   0:03.99 systemd
     2 root      20   0       0      0      0 S   0.0  0.0   0:00.02 kthreadd
     3 root      20   0       0      0      0 S   0.0  0.0   0:03.75 ksoftirqd/0
     5 root       0 -20       0      0      0 S   0.0  0.0   0:00.00 kworker/0:0H
     6 root      20   0       0      0      0 S   0.0  0.0   0:00.01 kworker/u256:0
     7 root      rt   0       0      0      0 S   0.0  0.0   0:00.06 migration/0
     8 root      20   0       0      0      0 S   0.0  0.0   0:00.00 rcu_bh
     9 root      20   0       0      0      0 S   0.0  0.0   0:02.26 rcu_sched
    10 root       0 -20       0      0      0 S   0.0  0.0   0:00.00 lru-add-drain
    11 root      rt   0       0      0      0 S   0.0  0.0   0:00.97 watchdog/0
    12 root      rt   0       0      0      0 S   0.0  0.0   0:00.33 watchdog/1
    13 root      rt   0       0      0      0 S   0.0  0.0   0:00.06 migration/1
    14 root      20   0       0      0      0 S   0.0  0.0   0:03.67 ksoftirqd/1
top - 23:05:08 up 22:36,  3 users,  load average: 0.34, 0.66, 0.72
Tasks: 114 total,   2 running, 112 sleeping,   0 stopped,   0 zombie
%Cpu(s): 14.0 us, 35.9 sy,  0.0 ni, 50.1 id,  0.0 wa,  0.0 hi,  0.0 si,  0.0 st
KiB Mem :   997980 total,   843416 free,    62840 used,    91724 buff/cache
KiB Swap:  2097148 total,  2035292 free,    61856 used.   798888 avail Mem
Send pid 4166 signal [15/sigterm]
   PID USER      PR  NI    VIRT    RES    SHR S  %CPU %MEM     TIME+ COMMAND
  4166 root      20   0  107992    612    512 R 100.0  0.1   0:29.70 dd
     1 root      20   0  127944   3256   2092 S   0.0  0.3   0:03.99 systemd
     2 root      20   0       0      0      0 S   0.0  0.0   0:00.02 kthreadd
     3 root      20   0       0      0      0 S   0.0  0.0   0:03.75 ksoftirqd/0
     5 root       0 -20       0      0      0 S   0.0  0.0   0:00.00 kworker/0:0H
     6 root      20   0       0      0      0 S   0.0  0.0   0:00.01 kworker/u256:0
     7 root      rt   0       0      0      0 S   0.0  0.0   0:00.06 migration/0
     8 root      20   0       0      0      0 S   0.0  0.0   0:00.00 rcu_bh
     9 root      20   0       0      0      0 S   0.0  0.0   0:02.26 rcu_sched
    10 root       0 -20       0      0      0 S   0.0  0.0   0:00.00 lru-add-drain
    11 root      rt   0       0      0      0 S   0.0  0.0   0:00.97 watchdog/0
    12 root      rt   0       0      0      0 S   0.0  0.0   0:00.33 watchdog/1
    13 root      rt   0       0      0      0 S   0.0  0.0   0:00.06 migration/1
    14 root      20   0       0      0      0 S   0.0  0.0   0:03.67 ksoftirqd/1
    16 root       0 -20       0      0      0 S   0.0  0.0   0:00.00 kworker/1:0H
(六)保存文件:W
[root@centos72 ~]# cat  /root/.toprc
top's Config File (Linux processes with windows)
Id:i, Mode_altscr=0, Mode_irixps=1, Delay_time=3.0, Curwin=0
Def    fieldscur=¥¨³´»½D·º¹æ')*+,-./012568<>?ABCFGHIJKLMNOPQRSTUVWXYZ[]^_`abcdefghij
    winflags=193844, sortindx=18, maxtasks=0, graph_cpus=0, graph_mems=0
    summclr=1, msgsclr=1, headclr=3, taskclr=1
Job    fieldscur=¥¦¹·º(³´Ļ½@<§é*+,-./012568>?ABCFGHIJKLMNOPQRSTUVWXYZ[]^_`abcdefghij
    winflags=193844, sortindx=0, maxtasks=0, graph_cpus=0, graph_mems=0
    summclr=6, msgsclr=6, headclr=7, taskclr=6
Mem    fieldscur=¥º»<½¾¿AMBN34·æ'()*+,-./0125689FGHIJKLOPQRSTUVWXYZ[]^_`abcdefghij
    winflags=193844, sortindx=21, maxtasks=0, graph_cpus=0, graph_mems=0
    summclr=5, msgsclr=5, headclr=4, taskclr=5
Usr    fieldscur=¥¦§¨ª°¹·ºŅ)+,-./1234568;<=>?@ABCFGHIJKLMNOPQRSTUVWXYZ[]^_`abcdefghij
    winflags=193844, sortindx=3, maxtasks=0, graph_cpus=0, graph_mems=0
    summclr=3, msgsclr=3, headclr=2, taskclr=3
Fixed_widest=0, Summ_mscale=0, Task_mscale=0, Zero_suppress=0
(七)top命令行的相关选项
-d #: 指定刷新时间间隔,默认为3秒
-b: 全部显示所有进程
-n #: 刷新多少次后退出
[root@centos72 ~]# time  top -d  2   -n  3
top - 00:36:16 up 1 day, 8 min,  3 users,  load average: 0.00, 0.01, 0.05
Tasks: 113 total,   1 running, 112 sleeping,   0 stopped,   0 zombie
%Cpu(s):  0.0 us,  0.0 sy,  0.0 ni,100.0 id,  0.0 wa,  0.0 hi,  0.0 si,  0.0 st
KiB Mem :   997980 total,   835168 free,    65176 used,    97636 buff/cache
KiB Swap:  2097148 total,  2037084 free,    60064 used.   793636 avail Mem

   PID USER      PR  NI    VIRT    RES    SHR S  %CPU %MEM     TIME+ COMMAND
     1 root      20   0  127944   3264   2096 S   0.0  0.3   0:04.23 systemd
     2 root      20   0       0      0      0 S   0.0  0.0   0:00.02 kthreadd
     3 root      20   0       0      0      0 S   0.0  0.0   0:03.76 ksoftirqd/0
     5 root       0 -20       0      0      0 S   0.0  0.0   0:00.00 kworker/0:0H
     6 root      20   0       0      0      0 S   0.0  0.0   0:00.01 kworker/u256:0
     7 root      rt   0       0      0      0 S   0.0  0.0   0:00.14 migration/0
     8 root      20   0       0      0      0 S   0.0  0.0   0:00.00 rcu_bh
     9 root      20   0       0      0      0 S   0.0  0.0   0:02.37 rcu_sched
    10 root       0 -20       0      0      0 S   0.0  0.0   0:00.00 lru-add-drain
    11 root      rt   0       0      0      0 S   0.0  0.0   0:01.00 watchdog/0
    12 root      rt   0       0      0      0 S   0.0  0.0   0:00.35 watchdog/1
    13 root      rt   0       0      0      0 S   0.0  0.0   0:00.06 migration/1
    14 root      20   0       0      0      0 S   0.0  0.0   0:03.67 ksoftirqd/1
    16 root       0 -20       0      0      0 S   0.0  0.0   0:00.00 kworker/1:0H
    18 root      20   0       0      0      0 S   0.0  0.0   0:00.02 kdevtmpfs

real    0m4.235s
user    0m0.048s
sys    0m0.032s
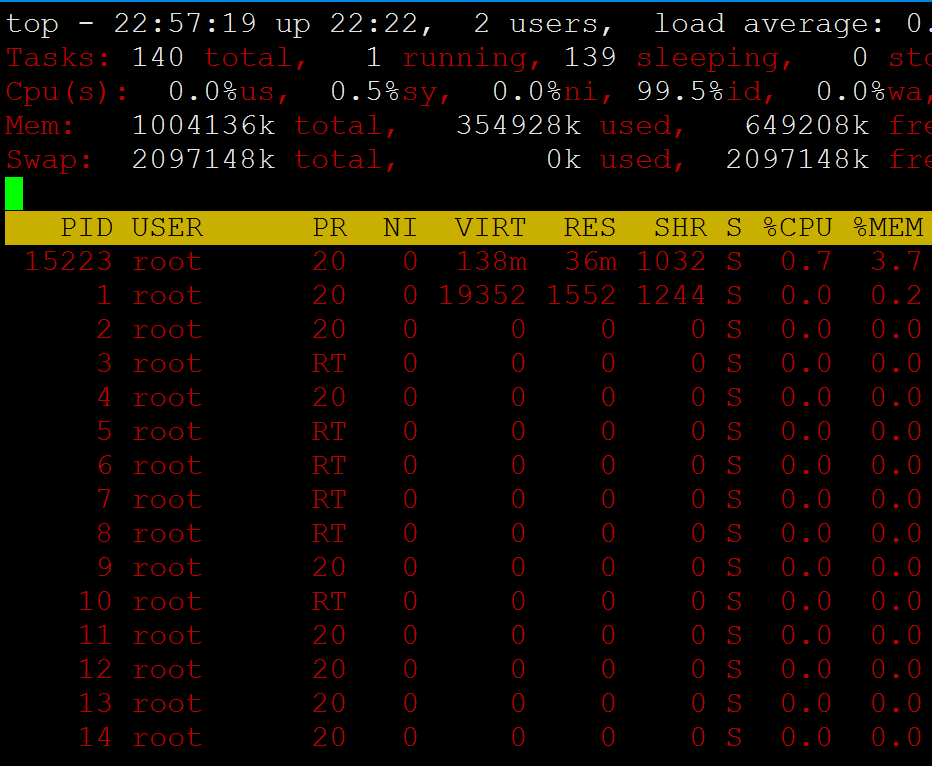
三htop命令
htop软件包来自EPEL源
选项:
-d #: 指定延迟时间;
-u UserName: 仅显示指定用户的进程
-s COLUME: 以指定字段进行排序
子命令:
s: 跟踪选定进程的系统调用
l: 显示选定进程打开的文件列表
a:将选定的进程绑定至某指定CPU核心
t: 显示进程树
(一)安装htop
[root@centos72 ~]# df
Filesystem     1K-blocks    Used Available Use% Mounted on
/dev/sda2       52403200 1211556  51191644   3% /
devtmpfs          487964       0    487964   0% /dev
tmpfs             498988       0    498988   0% /dev/shm
tmpfs             498988    7844    491144   2% /run
tmpfs             498988       0    498988   0% /sys/fs/cgroup
/dev/sda3       20961280   32980  20928300   1% /app
/dev/sda1        1038336  126596    911740  13% /boot
tmpfs              99800       0     99800   0% /run/user/0
[root@centos72 ~]# mount /dev/cdrom  /mnt/
mount: /dev/sr0 is write-protected, mounting read-only
[root@centos72 ~]# yum  repolist
Loaded plugins: fastestmirror
Loading mirror speeds from cached hostfile
base                                                                             | 3.6 kB  00:00:00
(1/2): epel/primary_db                                                           | 6.7 MB  00:00:01
(2/2): ali-centos/primary_db                                                     | 6.0 MB  00:00:02
repo id                                          repo name                                        status
ali-centos                                       ali-centos                                       10,019
base                                             base                                              3,971
epel                                             epel                                             13,190
repolist: 27,180
[root@centos72 ~]# yum install htop
Loaded plugins: fastestmirror
Loading mirror speeds from cached hostfile
Resolving Dependencies
--> Running transaction check
---> Package htop.x86_64 0:2.2.0-3.el7 will be installed
--> Finished Dependency Resolution

Dependencies Resolved

========================================================================================================
 Package               Arch                    Version                      Repository             Size
========================================================================================================
Installing:
 htop                  x86_64                  2.2.0-3.el7                  epel                  103 k

Transaction Summary
========================================================================================================
Install  1 Package

Total download size: 103 k
Installed size: 218 k
Is this ok [y/d/N]: y
Downloading packages:
htop-2.2.0-3.el7.x86_64.rpm                                                      | 103 kB  00:00:00
Running transaction check
Running transaction test
Transaction test succeeded
Running transaction
  Installing : htop-2.2.0-3.el7.x86_64                                                              1/1
  Verifying  : htop-2.2.0-3.el7.x86_64                                                              1/1

Installed:
  htop.x86_64 0:2.2.0-3.el7

Complete!
(二)htop子命令
只要鼠标点击就会显示相应的内容
子命令:
s: 跟踪选定进程的系统调用,系统调用是底层内核级的
l: 显示选定进程打开的文件列表
a:将选定的进程绑定至某指定CPU核心
t: 显示进程树
显示系统调用的整个过程,偏操作系统底层
[root@centos72 ~]# strace /bin/ls
execve("/bin/ls", ["/bin/ls"], [/* 24 vars */]) = 0
brk(NULL) = 0x25ca000
mmap(NULL, 4096, PROT_READ|PROT_WRITE, MAP_PRIVATE|MAP_ANONYMOUS, -1, 0) = 0x7f36377aa000
access("/etc/ld.so.preload", R_OK) = -1 ENOENT (No such file or directory)
open("/etc/ld.so.cache", O_RDONLY|O_CLOEXEC) = 3
fstat(3, {st_mode=S_IFREG|0644, st_size=19365, ...}) = 0
mmap(NULL, 19365, PROT_READ, MAP_PRIVATE, 3, 0) = 0x7f36377a5000
close(3) = 0
open("/lib64/libselinux.so.1", O_RDONLY|O_CLOEXEC) = 3
read(3, "177ELF211���������3�>�1���320i������"..., 832) = 832
fstat(3, {st_mode=S_IFREG|0755, st_size=155784, ...}) = 0
mmap(NULL, 2255184, PROT_READ|PROT_EXEC, MAP_PRIVATE|MAP_DENYWRITE, 3, 0) = 0x7f3637363000
mprotect(0x7f3637387000, 2093056, PROT_NONE) = 0
mmap(0x7f3637586000, 8192, PROT_READ|PROT_WRITE, MAP_PRIVATE|MAP_FIXED|MAP_DENYWRITE, 3, 0x23000) = 0x7f3637586000
mmap(0x7f3637588000, 6480, PROT_READ|PROT_WRITE, MAP_PRIVATE|MAP_FIXED|MAP_ANONYMOUS, -1, 0) = 0x7f3637588000
close(3) = 0
open("/lib64/libcap.so.2", O_RDONLY|O_CLOEXEC) = 3
read(3, "177ELF211���������3�>�1��� 26������"..., 832) = 832
fstat(3, {st_mode=S_IFREG|0755, st_size=20032, ...}) = 0
mmap(NULL, 2114112, PROT_READ|PROT_EXEC, MAP_PRIVATE|MAP_DENYWRITE, 3, 0) = 0x7f363715e000
mprotect(0x7f3637162000, 2093056, PROT_NONE) = 0
mmap(0x7f3637361000, 8192, PROT_READ|PROT_WRITE, MAP_PRIVATE|MAP_FIXED|MAP_DENYWRITE, 3, 0x3000) = 0x7f3637361000
close(3) = 0
open("/lib64/libacl.so.1", O_RDONLY|O_CLOEXEC) = 3
read(3, "177ELF211���������3�>�1���20037������"..., 832) = 832
fstat(3, {st_mode=S_IFREG|0755, st_size=37056, ...}) = 0
mmap(NULL, 4096, PROT_READ|PROT_WRITE, MAP_PRIVATE|MAP_ANONYMOUS, -1, 0) = 0x7f36377a4000
mmap(NULL, 2130560, PROT_READ|PROT_EXEC, MAP_PRIVATE|MAP_DENYWRITE, 3, 0) = 0x7f3636f55000
mprotect(0x7f3636f5c000, 2097152, PROT_NONE) = 0
mmap(0x7f363715c000, 8192, PROT_READ|PROT_WRITE, MAP_PRIVATE|MAP_FIXED|MAP_DENYWRITE, 3, 0x7000) = 0x7f363715c000
close(3) = 0
open("/lib64/libc.so.6", O_RDONLY|O_CLOEXEC) = 3
read(3, "177ELF2113��������3�>�1���P%2�����"..., 832) = 832
fstat(3, {st_mode=S_IFREG|0755, st_size=2173512, ...}) = 0
mmap(NULL, 3981792, PROT_READ|PROT_EXEC, MAP_PRIVATE|MAP_DENYWRITE, 3, 0) = 0x7f3636b88000
mprotect(0x7f3636d4b000, 2093056, PROT_NONE) = 0
mmap(0x7f3636f4a000, 24576, PROT_READ|PROT_WRITE, MAP_PRIVATE|MAP_FIXED|MAP_DENYWRITE, 3, 0x1c2000) = 0x7f3636f4a000
mmap(0x7f3636f50000, 16864, PROT_READ|PROT_WRITE, MAP_PRIVATE|MAP_FIXED|MAP_ANONYMOUS, -1, 0) = 0x7f3636f50000
close(3) = 0
open("/lib64/libpcre.so.1", O_RDONLY|O_CLOEXEC) = 3
read(3, "177ELF211���������3�>�1���36025������"..., 832) = 832
fstat(3, {st_mode=S_IFREG|0755, st_size=402384, ...}) = 0
mmap(NULL, 2494984, PROT_READ|PROT_EXEC, MAP_PRIVATE|MAP_DENYWRITE, 3, 0) = 0x7f3636926000
mprotect(0x7f3636986000, 2097152, PROT_NONE) = 0
mmap(0x7f3636b86000, 8192, PROT_READ|PROT_WRITE, MAP_PRIVATE|MAP_FIXED|MAP_DENYWRITE, 3, 0x60000) = 0x7f3636b86000
close(3) = 0
open("/lib64/libdl.so.2", O_RDONLY|O_CLOEXEC) = 3
read(3, "