需求描述:
1.echarts的平均值线
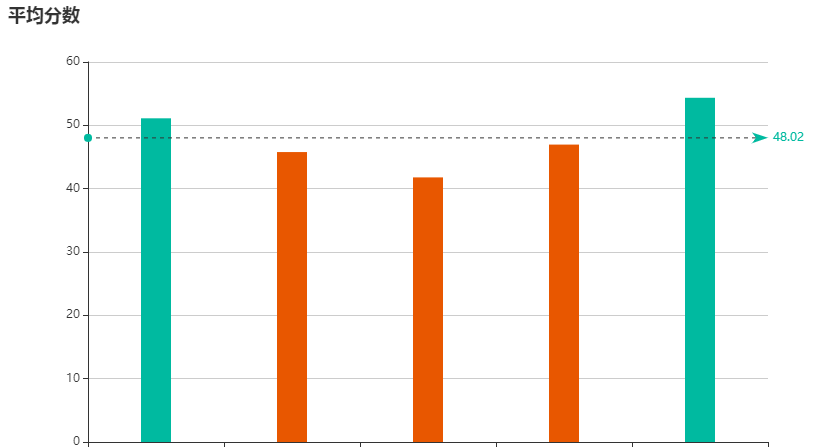
2.柱状图大于某个值显示为一种颜色,小于显示为另一种颜色
1.echarts的平均值线
只需在series选项里设置,此时的平均值会根据配置项series里的data项数组的值进行取平均值
series : [
  {
    name:'示例',
    type:'line',
    data:[10,20,30,40],
    markLine : {
      data : [
        {type : 'average', name: '平均值'}
      ]
    }
  }
]
如果平均值是从后台获取的,下面这样设置即可:
markLine: {
      data: [
            { yAxis: this.averagefraction }  // this.averagefraction是获取的平均值
      ]
},
2.柱状图大于某个值显示为一种颜色,小于显示为另一种颜色
设置 itemStyle
series: [{
              data: data.fractionArr,
              barWidth: 30,//柱图宽度
              type: 'bar',
              itemStyle: {
                normal: {
                  color: (params) => {
                    if(params.value < 60) {
                      return '#E85700'
                    } else {
                      return '#00BAA0'
                    }
                  }
                }
              }
          }]