笔记
7、断路器Dashboard监控仪表盘实战
简介:讲解断路器Dashboard基础使用和查看
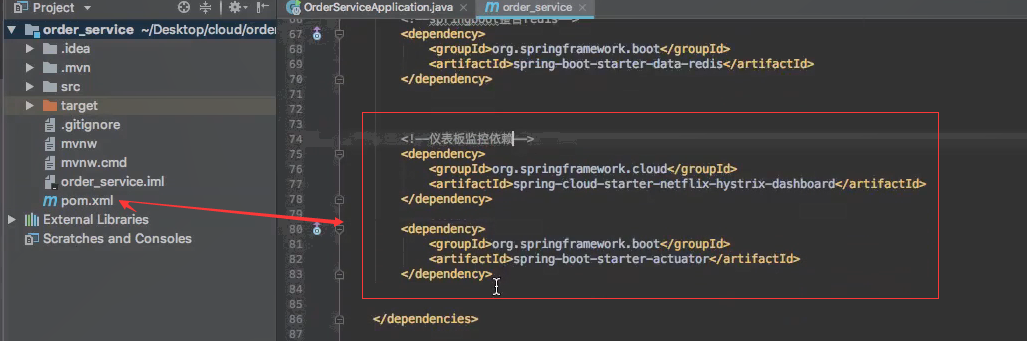
1、加入依赖
<dependency>
<groupId>org.springframework.cloud</groupId>
<artifactId>spring-cloud-starter-netflix-hystrix-dashboard</artifactId>
</dependency>
<dependency>
<groupId>org.springframework.boot</groupId>
<artifactId>spring-boot-starter-actuator</artifactId>
</dependency>
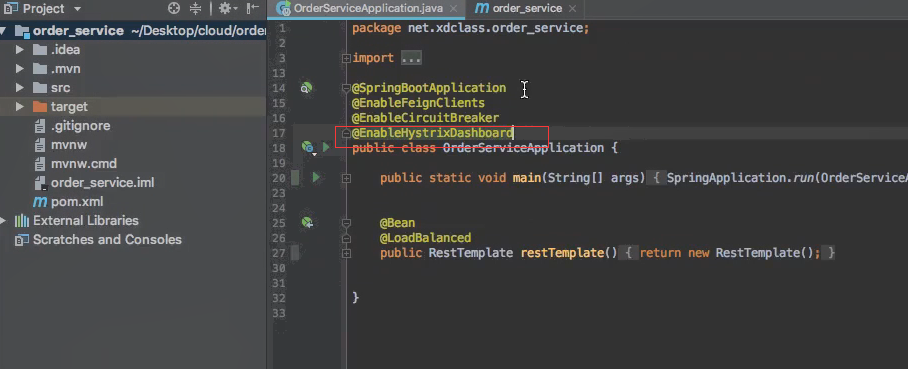
2、启动类增加注解
@EnableHystrixDashboard
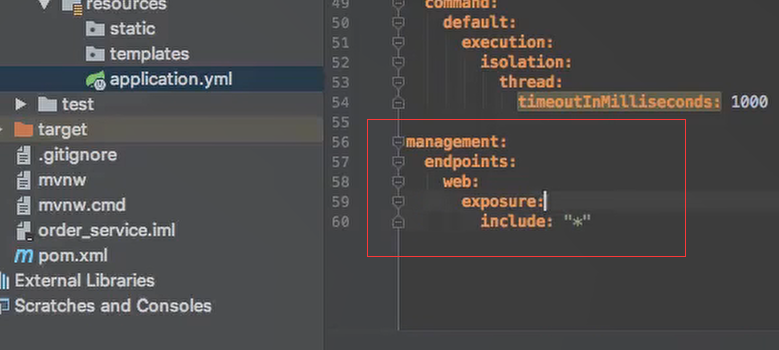
3、配置文件增加endpoint
management:
endpoints:
web:
exposure:
include: "*"
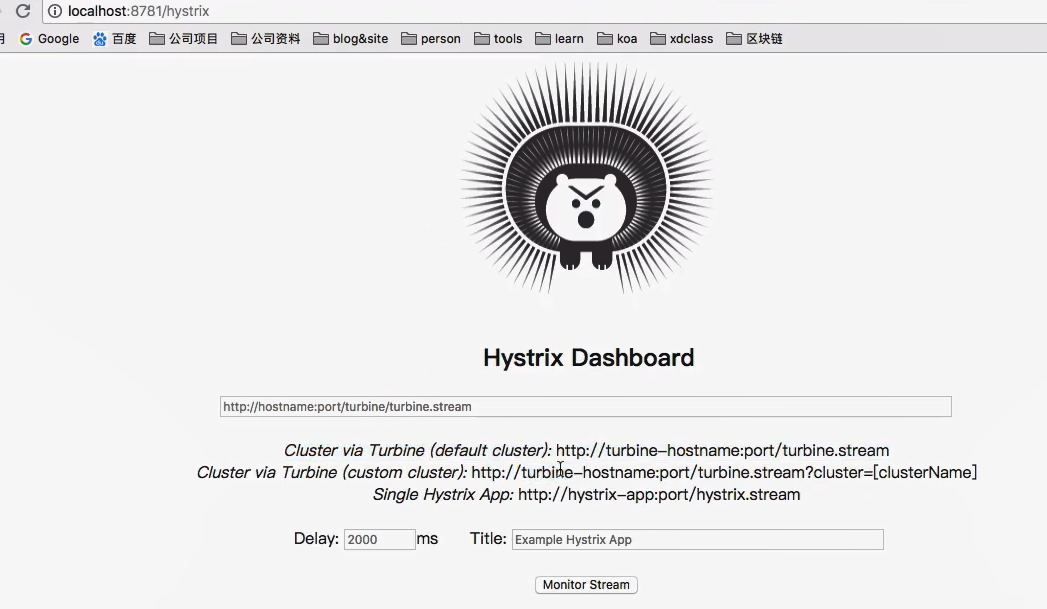
4、访问入口
http://localhost:8781/hystrix
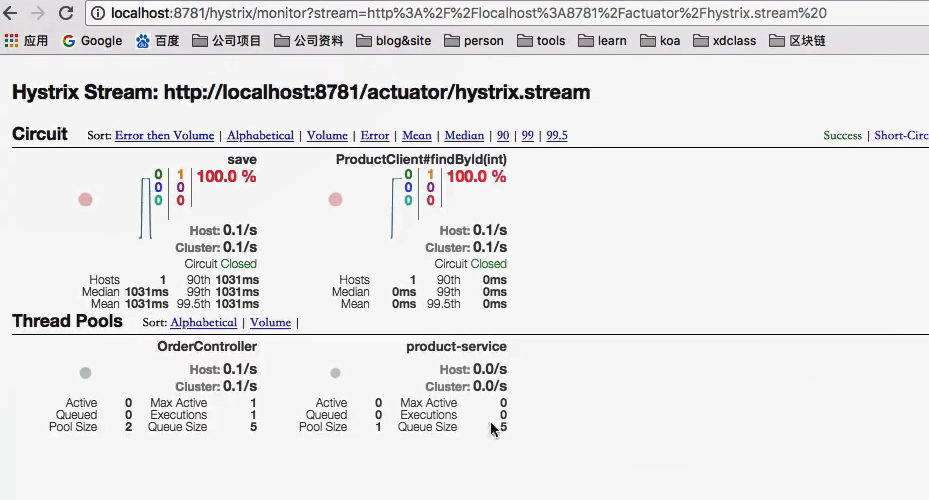
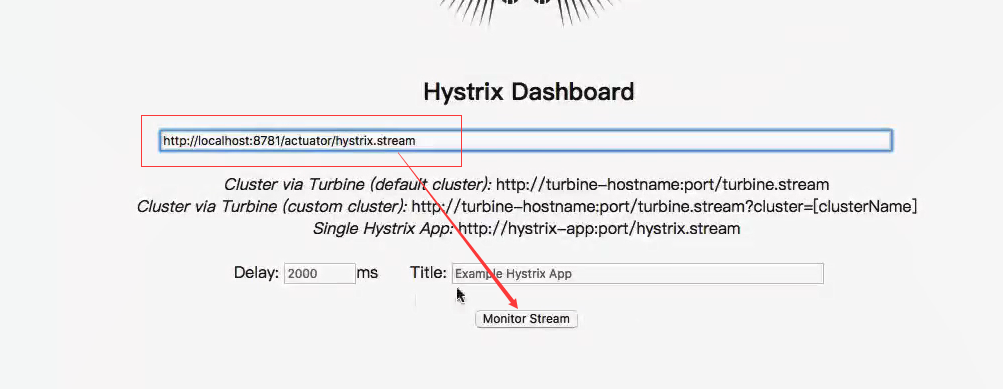
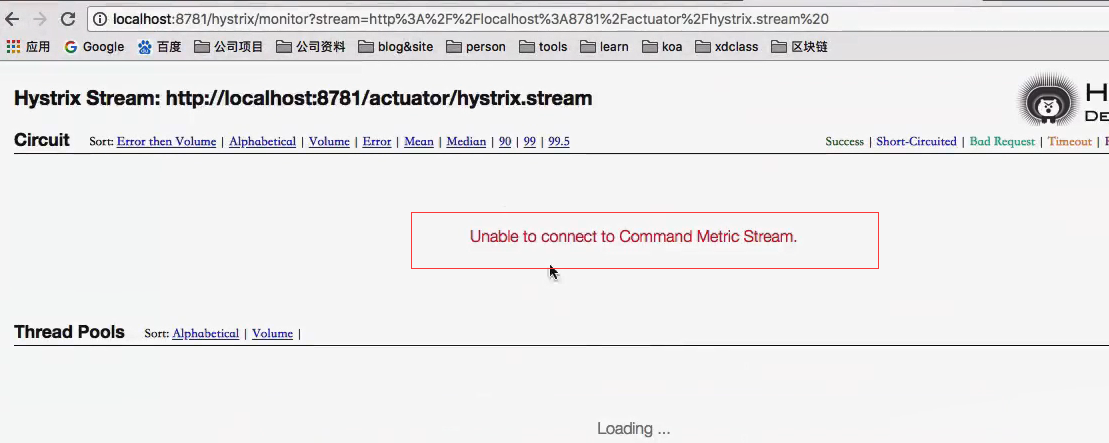
Hystrix Dashboard输入: http://localhost:8781/actuator/hystrix.stream
参考资料
默认开启监控配置
https://docs.spring.io/spring-boot/docs/current-SNAPSHOT/reference/htmlsingle/#boot-features-security-actuator
配置文件类:
spring-configuration-metadata.json
开始
一般加上报警器就可以了 短信报等
这是仪表盘的界面
加入两个依赖在OrderService里面
启动类里面加入注解
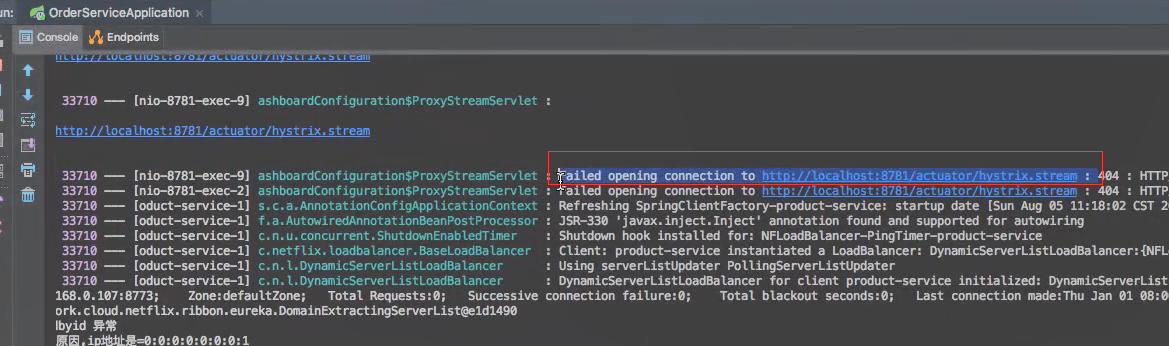
不能连接源数据信息
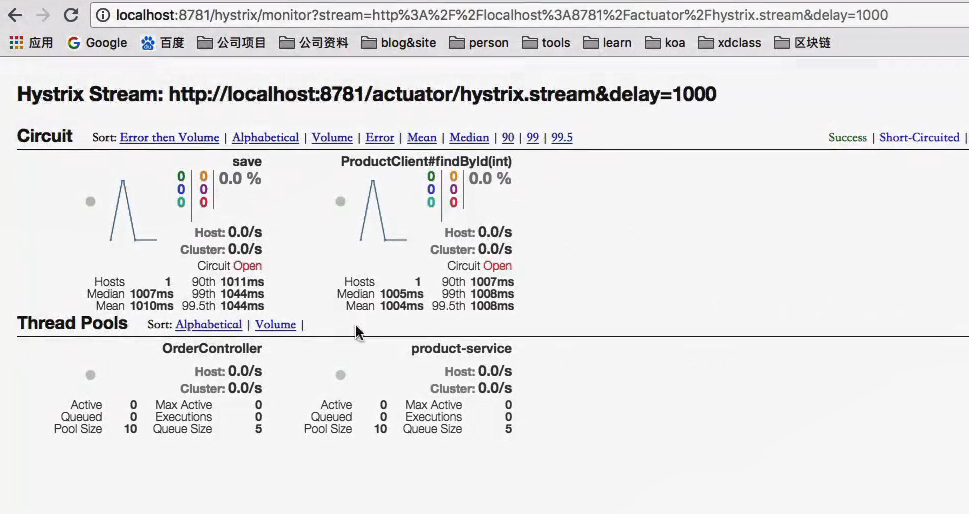
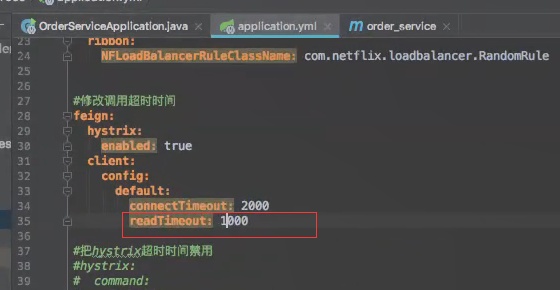
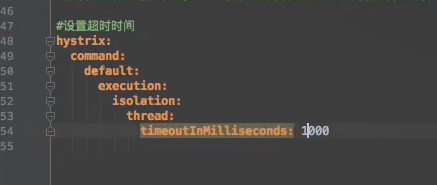
先把超时时间都改为1秒。feign和hytrix都改成1秒
星号表示暴露全部端点
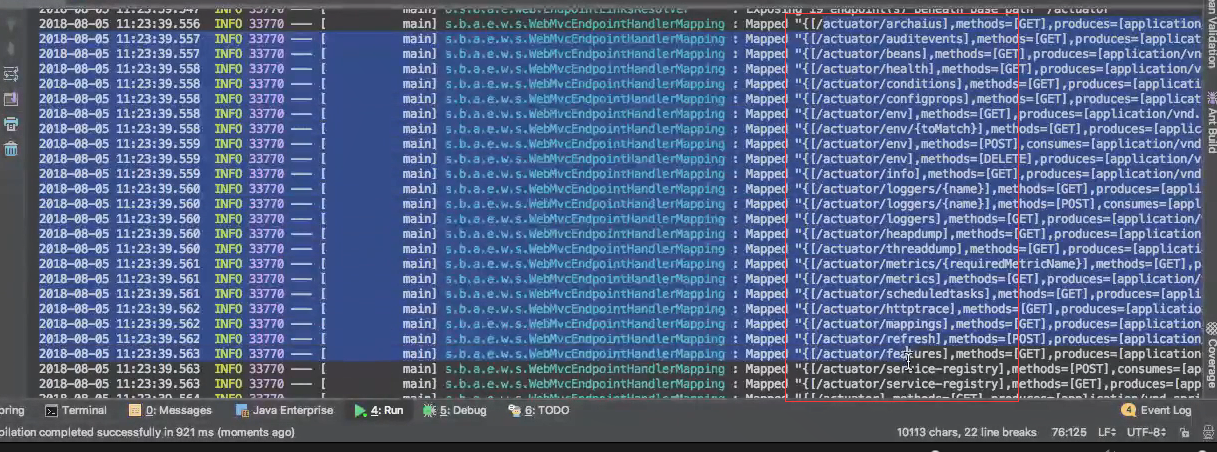
重启应用
启动日志里面以为actuator开头的
这里就编程了Loading
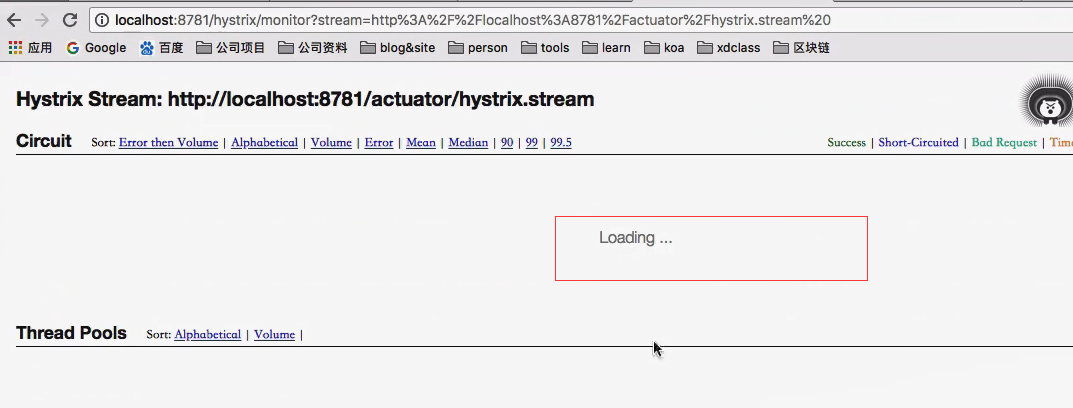
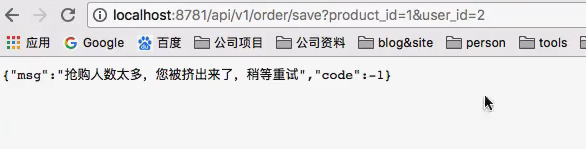
访问几次接口。因为把超时时间设置为1秒了所以这里肯定就报错了。