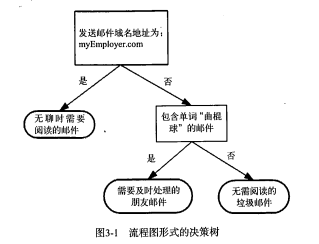
上图所示流程图就是一个决策树,长方形代表判断模块,椭圆形代表终止模块,表示已经得出结论,可以终止运行。从判断模块引出的左右箭头成为分支,它可以到达另一个判断模块或者终止模块。
k-近邻算法最大的缺点就是无法给出数据的内在含义,决策树的主要优势在于数据形式非常容易理解。
决策树的一个重要任务是为了理解数据中所蕴含的知识信息,因此决策树可以使用不熟悉的数据结合,并从中提取出一系列规则,这些机器根据数据集创建规则的过程,就是机器学习的过程。
在构建决策树时,我们需要解决的的第一个问题就是,当前数据集上哪个特征在划分数据分类时起决定性作用。为了找到决定性的特征,划分出最好的结果,我们必须评估每个特征。完成测试之后,原始数据集就被划分为几个数据子集。这些数据子集会分布在第一个决策点的所有分支上。如果某个分支下的数据属于同一类型,则当前无需阅读的垃圾邮件已经正确地划分数据分类,无需进一步对数据集进行分割。如果数据子集内的数据不属于同一类型,则需要重复划分数据子集的过程。划分数据子集的算法和划分原始数据集的方法相同,知直到所有具有相同类型的数据均在一个数据子集内。
(1)信息增益
划分数据集的大原则是:将无序的数据变得更加有序,可以使用信息论度量信息。
在划分数据集前后信息发生的变化称为信息增益,知道如何计算信息增益,就可以计算每个特征值划分数据集获得的信息增益,获得信息增益最高的特征就是最好的选择。
熵定义为信息的期望值,符号xi的信息定义为,其中p(xi)是选择该分类的概率
![]()
计算所有类别所有可能值包含的信息期望值,通过下面的公式
![]()
举个例子
先将数据简单表示出来
def createDataSet():
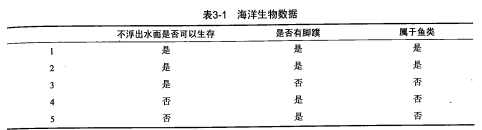
dataSet = [[1, 1, 'yes'],
[1, 1, 'yes'],
[1, 0, 'no'],
[0, 1, 'no'],
[0, 1, 'no']]
labels = ['no surfacing', 'flippers']
return dataSet, labels
计算熵
def calcShannonEnt(dataSet):
    # 数据集中实例的总数
    numEntries = len(dataSet)
    labelCounts = {}
    # 为所有可能分类创建字典
    for featVec in dataSet:
        currentLabel = featVec[-1]
        if currentLabel not in labelCounts.keys():
            labelCounts[currentLabel] = 0
        labelCounts[currentLabel] += 1
    shannonEnt = 0.0
    for key in labelCounts:
        # 计算类别出现的概率
        prob = float(labelCounts[key]) / numEntries
        shannonEnt -= prob * log(prob, 2)
    return shannonEnt
运行测试
if __name__ == '__main__':
    myDat, labels = createDataSet()
    print(myDat)
    print(calcShannonEnt(myDat))
    myDat[0][-1] = 'maybe'
    print(myDat)
    print(calcShannonEnt(myDat))
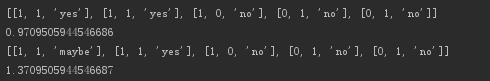
可以发现熵越高,混合的数据也越多。
(2)划分数据集
2.1 按照给定特征划分数据集(返回原数据集去掉抽取的特征列)
def splitDataSet(dataSet, axis, value):
    retDataSet = []
    for featVec in dataSet:
        if featVec[axis] == value:
            reducedFeatVec = featVec[:axis]
            reducedFeatVec.extend(featVec[axis + 1:])
            retDataSet.append(reducedFeatVec)
    return retDataSet
运行测试
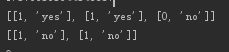
>>>print(splitDataSet(myDat, 0, 1))
>>>print(splitDataSet(myDat, 0, 0))
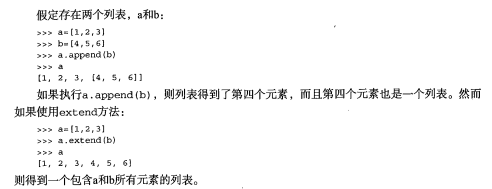
extend()和append()的区别和用法可以具体百度,下面是书中的介绍
2.2 选择最好的数据集划分方式
def chooseBestFeatureToSplit(dataSet):
    numFeatures = len(dataSet[0]) - 1
    baseEntropy = calcShannonEnt(dataSet)
    bestInfoGain = 0.0
    bestFeature = -1
    for i in range(numFeatures):
        # 创建唯一的分类标签列表
        featList = [example[i] for example in dataSet]
        uniqueVals = set(featList)
        newEntropy = 0.0
        # 计算每种划分方式的信息熵
        for value in uniqueVals:
            subDataSet = splitDataSet(dataSet, i, value)
            prob = len(subDataSet) / float(len(dataSet))
            newEntropy += prob * calcShannonEnt(subDataSet)
        infoGain = baseEntropy - newEntropy
        # 计算最好的信息增益
        if (infoGain > bestInfoGain):
            bestInfoGain = infoGain
            bestFeature = i
    return bestFeature
运行测试
print(chooseBestFeatureToSplit(myDat))
得到0,说明第0个特征是最好的用于划分数据集的特征。
(3)递归构建决策树
# 返回出现次数最多的分类名称
def majorityCnt(classList):
    classCount = {}
    for vote in classList:
        if vote not in classCount.keys():
            classCount[vote] = 0
        classCount[vote] += 1
    sortedClassCount = sorted(classCount.items(),
                              key=operator.itemgetter(1), reversed=True)
    return sortedClassCount[0][0]
def createTree(dataSet, labels):
    classList = [example[-1] for example in dataSet]
    # 停止条件1:所有的类标签完全相同则停止划分,直接返回该类标签
    if classList.count(classList[0]) == len(classList):
        return classList[0]
    # 停止条件2:使用完了所有特征,仍然不能将数据集划分成仅包含唯一类别的分组
    # 则使用majorityCnt()遍历所有特征挑选出现次数最多的类别作为返回值
    if len(dataSet[0]) == 1:
        return majorityCnt(classList)

    bestFeat = chooseBestFeatureToSplit(dataSet)
    bestFeatLabel = labels[bestFeat]
    myTree = {bestFeatLabel: {}}
    #删除标签
    del (labels[bestFeat])
    featValues = [example[bestFeat] for example in dataSet]
    uniqueVals = set(featValues)
    for value in uniqueVals:
        subLabels = labels[:]
        myTree[bestFeatLabel][value] = createTree(splitDataSet(dataSet, bestFeat, value), subLabels)
    return myTree
运行测试
myTree = createTree(myDat, labels)
print(myTree)

结果看起来不太直观,所以我们把它画出来
(4)使用Matplotlib注解绘制树形图
中文防止乱码参照https://my.oschina.net/u/1180306/blog/279818 和 https://www.cnblogs.com/csj007523/p/7418097.html
这里用了第一种方法
一个中文防乱码的文件ch.py
def set_ch():
    from pylab import mpl
    mpl.rcParams['font.sans-serif'] = ['FangSong']  # 指定默认字体
    mpl.rcParams['axes.unicode_minus'] = False  # 解决保存图像是负号'-'显示为方块的问题
treePlotter.py
import matplotlib.pyplot as plt
import ch
# 定义文本框和箭头格式
decisionNode = dict(boxstyle="sawtooth", fc="0.8")
leafNode = dict(boxstyle="round4", fc="0.8")
arrow_args = dict(arrowstyle="<-")
ch.set_ch()
# 绘制带箭头的注解
# 该函数执行了实际的绘图功能,该函数需要一个绘图区
# 该区域由全局变量createPlot.ax1定义
def plotNode(nodeText, centerPt, parentPt, nodeType):
createPlot.ax1.annotate(nodeText,
xy=parentPt,
xycoords='axes fraction',
xytext=centerPt, textcoords='axes fraction',
va="center",
ha="center",
bbox=nodeType,
arrowprops=arrow_args)
def createPlot():
fig = plt.figure(1, facecolor='white')
fig.clf()
createPlot.ax1 = plt.subplot(111, frameon=False)
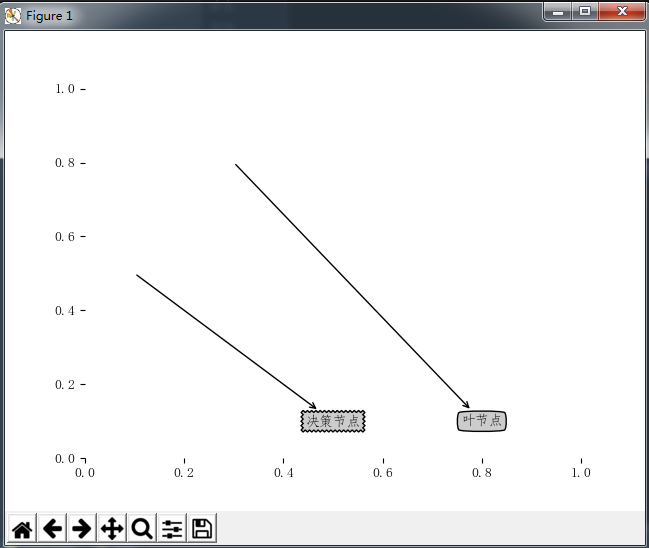
plotNode('决策节点', (0.5, 0.1), (0.1, 0.5), decisionNode)
plotNode('叶节点', (0.8, 0.1), (0.3, 0.8), leafNode)
plt.show()
if __name__ == '__main__':
createPlot()
结果如下
获取叶节点个数以确定x轴长度
# 获取叶节点的数目
def getNumLeafs(myTree):
    numLeafs = 0
    #py2
    #firstStr = myTree.keys()[0]
    #py3
    firstStr=list(myTree.keys())[0]
    secondDict = myTree[firstStr]
    for key in secondDict.keys():
        # 测试节点的数据类型是否为字典,如果是则进行递归
        if type(secondDict[key]).__name__ == 'dict':
            numLeafs += getNumLeafs(secondDict[key])
        else:
            numLeafs += 1
    return numLeafs
获取树层数以确定y轴高度
# 获取树的层数
def getTreeDepth(myTree):
    maxDepth = 0
    # py2
    # firstStr = myTree.keys()[0]
    # py3
    firstStr = list(myTree.keys())[0]
    secondDict = myTree[firstStr]
    for key in secondDict.keys():
        if type(secondDict[key]).__name__ == 'dict':
            thisDepth = 1 + getTreeDepth(secondDict[key])
        else:
            thisDepth = 1
        if thisDepth > maxDepth:
            maxDepth = thisDepth
    return maxDepth
预先存储数的信息避免重复建树
# 输出预先存储的树的信息
def retrieveTree(i):
    listOfTrees = [{'no surfacing': {0: 'no', 1: {'flippers':
                                                      {0: 'no', 1: 'yes'}}}},
                   {'no surfacing': {0: 'no', 1: {'flippers':
                                                      {0: {'head': {0: 'no', 1: 'yes'}}, 1: 'no'}}}}
                   ]
    return listOfTrees[i]
测试运行
if __name__ == '__main__':
createPlot()
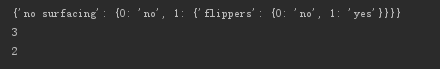
myTree = retrieveTree(0)
print(myTree)
print(getNumLeafs(myTree))
print(getTreeDepth(myTree))
更新绘图函数
import matplotlib.pyplot as plt
import ch
# 定义文本框和箭头格式
decisionNode = dict(boxstyle="sawtooth", fc="0.8")
leafNode = dict(boxstyle="round4", fc="0.8")
arrow_args = dict(arrowstyle="<-")
ch.set_ch()
# 绘制带箭头的注解
# 该函数执行了实际的绘图功能,该函数需要一个绘图区
# 该区域由全局变量createPlot.ax1定义
def plotNode(nodeText, centerPt, parentPt, nodeType):
createPlot.ax1.annotate(nodeText,
xy=parentPt,
xycoords='axes fraction',
xytext=centerPt, textcoords='axes fraction',
va="center",
ha="center",
bbox=nodeType,
arrowprops=arrow_args)
# 获取叶节点的数目
def getNumLeafs(myTree):
numLeafs = 0
# py2
# firstStr = myTree.keys()[0]
# py3
firstStr = list(myTree.keys())[0]
secondDict = myTree[firstStr]
for key in secondDict.keys():
# 测试节点的数据类型是否为字典,如果是则进行递归
if type(secondDict[key]).__name__ == 'dict':
numLeafs += getNumLeafs(secondDict[key])
else:
numLeafs += 1
return numLeafs
# 获取树的层数
def getTreeDepth(myTree):
maxDepth = 0
# py2
# firstStr = myTree.keys()[0]
# py3
firstStr = list(myTree.keys())[0]
secondDict = myTree[firstStr]
for key in secondDict.keys():
if type(secondDict[key]).__name__ == 'dict':
thisDepth = 1 + getTreeDepth(secondDict[key])
else:
thisDepth = 1
if thisDepth > maxDepth:
maxDepth = thisDepth
return maxDepth
# 输出预先存储的树的信息
def retrieveTree(i):
listOfTrees = [{'no surfacing': {0: 'no', 1: {'flippers':
{0: 'no', 1: 'yes'}}}},
{'no surfacing': {0: 'no', 1: {'flippers':
{0: {'head': {0: 'no', 1: 'yes'}}, 1: 'no'}}}}
]
return listOfTrees[i]
# 在父子节点间填充文本信息
def plotMidText(cntrPt, parentPt, txtString):
xMid = (parentPt[0] - cntrPt[0]) / 2.0 + cntrPt[0]
yMid = (parentPt[1] - cntrPt[1]) / 2.0 + cntrPt[1]
createPlot.ax1.text(xMid, yMid, txtString)
def plotTree(myTree, parentPt, nodeTxt):
numLeafs = getNumLeafs(myTree)
depth = getTreeDepth(myTree)
firstStr = list(myTree.keys())[0]
cntrPt = (plotTree.xOff + (1.0 + float(numLeafs)) / 2.0 / plotTree.totalW,
plotTree.yOff)
# 标记子节点属性值
plotMidText(cntrPt, parentPt, nodeTxt)
plotNode(firstStr, cntrPt, parentPt, decisionNode)
secondDict = myTree[firstStr]
# 减少y偏移
plotTree.yOff = plotTree.yOff - 1.0 / plotTree.totalD
for key in secondDict.keys():
if type(secondDict[key]).__name__ == 'dict':
plotTree(secondDict[key], cntrPt, str(key))
else:
plotTree.xOff = plotTree.xOff + 1.0 / plotTree.totalW
plotNode(secondDict[key], (plotTree.xOff, plotTree.yOff),
cntrPt, leafNode)
plotMidText((plotTree.xOff, plotTree.yOff), cntrPt, str(key))
plotTree.yOff = plotTree.yOff + 1.0 / plotTree.totalD
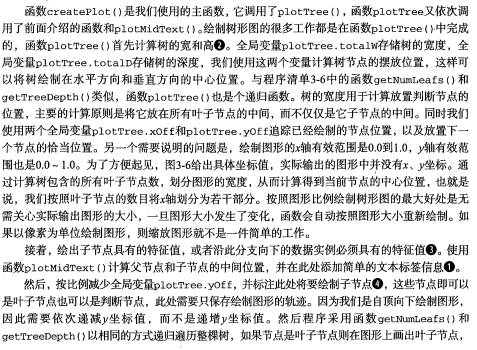
def createPlot(inTree):
fig = plt.figure(1, facecolor='white')
fig.clf()
axprops = dict(xticks=[], yticks=[])
createPlot.ax1 = plt.subplot(111, frameon=False, **axprops)
# 使用下面两个变量分别存储树的宽度和深度
# 计算树节点的摆放位置,这样可以将树绘制在水平方向和垂直方向的中心位置
plotTree.totalW = float(getNumLeafs(inTree))
plotTree.totalD = float(getTreeDepth(inTree))
plotTree.xOff = -0.5 / plotTree.totalW;
plotTree.yOff = 1.0;
plotTree(inTree, (0.5, 1.0), '')
plt.show()
好复杂...没有细看,书上的解释。。

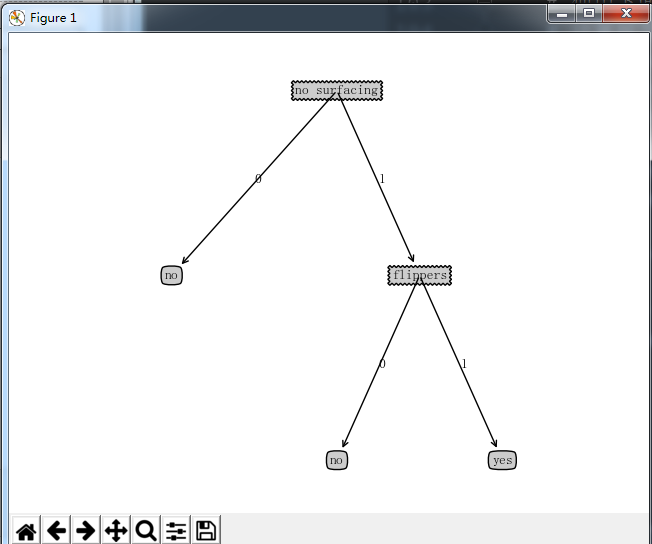
测试运行
myTree = retrieveTree(0)
createPlot(myTree)
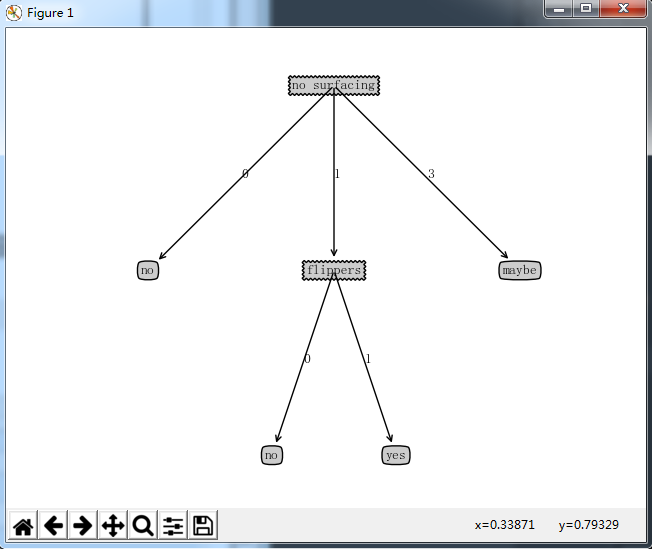
改个数值
myTree = retrieveTree(0)
myTree['no surfacing'][3] = 'maybe'
createPlot(myTree)
(5)测试和存储分类器
5.1 测试算法:使用决策树执行分类
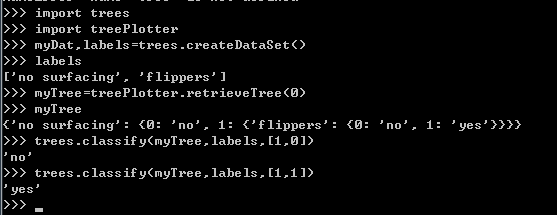
def classify(inputTree, featLabels, testVec):
    firstStr = list(inputTree.keys())[0]
    secondDict = inputTree[firstStr]
    # 将标签字符串转换为索引
    featIndex = featLabels.index(firstStr)
    for key in secondDict.keys():
        if testVec[featIndex] == key:
            if type(secondDict[key]).__name__ == 'dict':
                classLabel = classify(secondDict[key], featLabels, testVec)
            else:
                classLabel = secondDict[key]
    return classLabel
测试运行
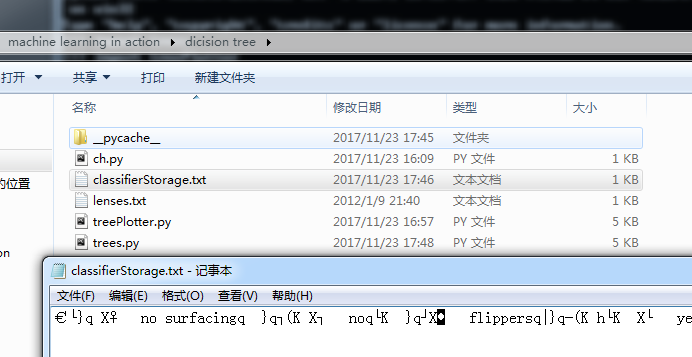
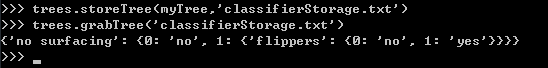
5.2 使用pickle模块存储决策树
def storeTree(inputTree, filename):
    import pickle
    # fw = open(filename, 'w')
    fw = open(filename, 'wb')
    pickle.dump(inputTree, fw)
    fw.close()


def grabTree(filename):
    import pickle
    # fr = open(filaname)
    fr = open(filename, 'rb')
    return pickle.load(fr)
测试运行
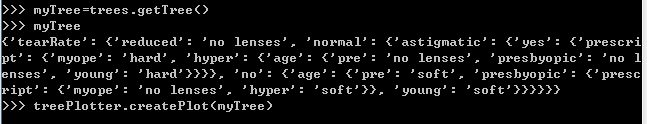
(6)示例:使用决策树预测隐形眼镜类型
def getTree():
    fr = open('lenses.txt')
    lenses = [inst.strip().split('	') for inst in fr.readlines()]
    lensesLabels = ['age', 'prescript', 'astigmatic', 'tearRate']
    lensesTree = createTree(lenses, lensesLabels)
    return lensesTree
测试运行
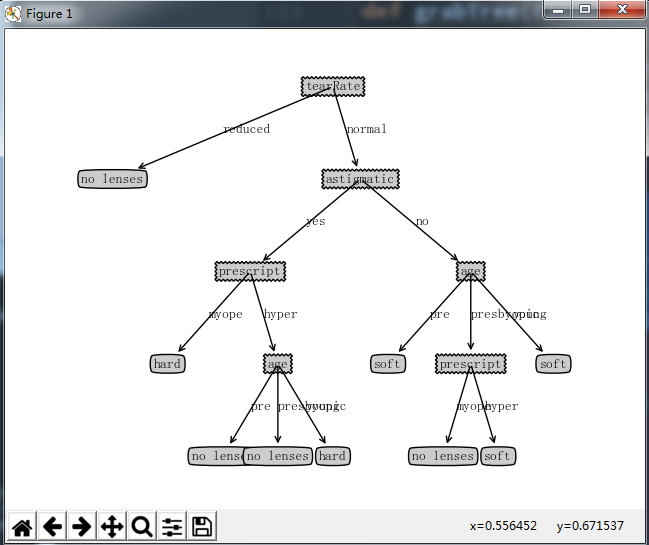
上面的决策树很好地匹配了实验数据,然而匹配选项可能太多造成过度匹配。可以裁剪决策树,去掉不必要的叶子节点。
如果决策树的某一叶子结点只能增加很少的信息,那么我们就可将该节点删掉,将其并入到相邻的结点中。
完整代码,不包括决策树分类测试、存储、隐形眼镜预测的测试代码


from math import log
import operator


def calcShannonEnt(dataSet):
    # 数据集中实例的总数
    numEntries = len(dataSet)
    labelCounts = {}
    # 为所有可能分类创建字典
    for featVec in dataSet:
        currentLabel = featVec[-1]
        if currentLabel not in labelCounts.keys():
            labelCounts[currentLabel] = 0
        labelCounts[currentLabel] += 1
    shannonEnt = 0.0
    for key in labelCounts:
        # 计算类别出现的概率
        prob = float(labelCounts[key]) / numEntries
        shannonEnt -= prob * log(prob, 2)
    return shannonEnt


def createDataSet():
    dataSet = [[1, 1, 'yes'],
               [1, 1, 'yes'],
               [1, 0, 'no'],
               [0, 1, 'no'],
               [0, 1, 'no']]
    labels = ['no surfacing', 'flippers']
    return dataSet, labels


def splitDataSet(dataSet, axis, value):
    retDataSet = []
    for featVec in dataSet:
        if featVec[axis] == value:
            reducedFeatVec = featVec[:axis]
            reducedFeatVec.extend(featVec[axis + 1:])
            retDataSet.append(reducedFeatVec)
    return retDataSet


def chooseBestFeatureToSplit(dataSet):
    numFeatures = len(dataSet[0]) - 1
    baseEntropy = calcShannonEnt(dataSet)
    bestInfoGain = 0.0
    bestFeature = -1
    for i in range(numFeatures):
        # 创建唯一的分类标签列表
        featList = [example[i] for example in dataSet]
        uniqueVals = set(featList)
        newEntropy = 0.0
        # 计算每种划分方式的信息熵
        for value in uniqueVals:
            subDataSet = splitDataSet(dataSet, i, value)
            prob = len(subDataSet) / float(len(dataSet))
            newEntropy += prob * calcShannonEnt(subDataSet)
        infoGain = baseEntropy - newEntropy
        # 计算最好的信息增益
        if (infoGain > bestInfoGain):
            bestInfoGain = infoGain
            bestFeature = i
    return bestFeature


# 返回出现次数最多的分类名称
def majorityCnt(classList):
    classCount = {}
    for vote in classList:
        if vote not in classCount.keys():
            classCount[vote] = 0
        classCount[vote] += 1
    sortedClassCount = sorted(classCount.items(),
                              key=operator.itemgetter(1), reverse=True)
    return sortedClassCount[0][0]


def createTree(dataSet, labels):
    classList = [example[-1] for example in dataSet]
    # 停止条件1:所有的类标签完全相同则停止划分,直接返回该类标签
    if classList.count(classList[0]) == len(classList):
        return classList[0]
    # 停止条件2:使用完了所有特征,仍然不能将数据集划分成仅包含唯一类别的分组
    # 则使用majorityCnt()遍历所有特征挑选出现次数最多的类别作为返回值
    if len(dataSet[0]) == 1:
        return majorityCnt(classList)

    bestFeat = chooseBestFeatureToSplit(dataSet)
    bestFeatLabel = labels[bestFeat]
    myTree = {bestFeatLabel: {}}
    # 删除标签
    del (labels[bestFeat])
    featValues = [example[bestFeat] for example in dataSet]
    uniqueVals = set(featValues)
    for value in uniqueVals:
        subLabels = labels[:]
        myTree[bestFeatLabel][value] = createTree(splitDataSet(dataSet, bestFeat, value), subLabels)
    return myTree


def classify(inputTree, featLabels, testVec):
    firstStr = list(inputTree.keys())[0]
    secondDict = inputTree[firstStr]
    # 将标签字符串转换为索引
    featIndex = featLabels.index(firstStr)
    for key in secondDict.keys():
        if testVec[featIndex] == key:
            if type(secondDict[key]).__name__ == 'dict':
                classLabel = classify(secondDict[key], featLabels, testVec)
            else:
                classLabel = secondDict[key]
    return classLabel


def storeTree(inputTree, filename):
    import pickle
    # fw = open(filename, 'w')
    fw = open(filename, 'wb')
    pickle.dump(inputTree, fw)
    fw.close()


def grabTree(filename):
    import pickle
    # fr = open(filaname)
    fr = open(filename, 'rb')
    return pickle.load(fr)


def getTree():
    fr = open('lenses.txt')
    lenses = [inst.strip().split('	') for inst in fr.readlines()]
    lensesLabels = ['age', 'prescript', 'astigmatic', 'tearRate']
    lensesTree = createTree(lenses, lensesLabels)
    return lensesTree

if __name__ == '__main__':
    # createPlot(getTree())
    pass
import matplotlib.pyplot as plt
import ch

# 定义文本框和箭头格式
decisionNode = dict(boxstyle="sawtooth", fc="0.8")
leafNode = dict(boxstyle="round4", fc="0.8")
arrow_args = dict(arrowstyle="<-")
ch.set_ch()


# 绘制带箭头的注解
# 该函数执行了实际的绘图功能,该函数需要一个绘图区
# 该区域由全局变量createPlot.ax1定义
def plotNode(nodeText, centerPt, parentPt, nodeType):
    createPlot.ax1.annotate(nodeText,
                            xy=parentPt,
                            xycoords='axes fraction',
                            xytext=centerPt, textcoords='axes fraction',
                            va="center",
                            ha="center",
                            bbox=nodeType,
                            arrowprops=arrow_args)


# 获取叶节点的数目
def getNumLeafs(myTree):
    numLeafs = 0
    # py2
    # firstStr = myTree.keys()[0]
    # py3
    firstStr = list(myTree.keys())[0]
    secondDict = myTree[firstStr]
    for key in secondDict.keys():
        # 测试节点的数据类型是否为字典,如果是则进行递归
        if type(secondDict[key]).__name__ == 'dict':
            numLeafs += getNumLeafs(secondDict[key])
        else:
            numLeafs += 1
    return numLeafs


# 获取树的层数
def getTreeDepth(myTree):
    maxDepth = 0
    # py2
    # firstStr = myTree.keys()[0]
    # py3
    firstStr = list(myTree.keys())[0]
    secondDict = myTree[firstStr]
    for key in secondDict.keys():
        if type(secondDict[key]).__name__ == 'dict':
            thisDepth = 1 + getTreeDepth(secondDict[key])
        else:
            thisDepth = 1
        if thisDepth > maxDepth:
            maxDepth = thisDepth
    return maxDepth


# 输出预先存储的树的信息
def retrieveTree(i):
    listOfTrees = [{'no surfacing': {0: 'no', 1: {'flippers':
                                                      {0: 'no', 1: 'yes'}}}},
                   {'no surfacing': {0: 'no', 1: {'flippers':
                                                      {0: {'head': {0: 'no', 1: 'yes'}}, 1: 'no'}}}}
                   ]
    return listOfTrees[i]


# 在父子节点间填充文本信息
def plotMidText(cntrPt, parentPt, txtString):
    xMid = (parentPt[0] - cntrPt[0]) / 2.0 + cntrPt[0]
    yMid = (parentPt[1] - cntrPt[1]) / 2.0 + cntrPt[1]
    createPlot.ax1.text(xMid, yMid, txtString)


def plotTree(myTree, parentPt, nodeTxt):
    numLeafs = getNumLeafs(myTree)
    depth = getTreeDepth(myTree)
    firstStr = list(myTree.keys())[0]
    cntrPt = (plotTree.xOff + (1.0 + float(numLeafs)) / 2.0 / plotTree.totalW,
              plotTree.yOff)
    # 标记子节点属性值
    plotMidText(cntrPt, parentPt, nodeTxt)
    plotNode(firstStr, cntrPt, parentPt, decisionNode)
    secondDict = myTree[firstStr]
    # 减少y偏移
    plotTree.yOff = plotTree.yOff - 1.0 / plotTree.totalD
    for key in secondDict.keys():
        if type(secondDict[key]).__name__ == 'dict':
            plotTree(secondDict[key], cntrPt, str(key))
        else:
            plotTree.xOff = plotTree.xOff + 1.0 / plotTree.totalW
            plotNode(secondDict[key], (plotTree.xOff, plotTree.yOff),
                     cntrPt, leafNode)
            plotMidText((plotTree.xOff, plotTree.yOff), cntrPt, str(key))
    plotTree.yOff = plotTree.yOff + 1.0 / plotTree.totalD


def createPlot(inTree):
    fig = plt.figure(1, facecolor='white')
    fig.clf()
    axprops = dict(xticks=[], yticks=[])
    createPlot.ax1 = plt.subplot(111, frameon=False, **axprops)
    # 使用下面两个变量分别存储树的宽度和深度
    # 计算树节点的摆放位置,这样可以将树绘制在水平方向和垂直方向的中心位置
    plotTree.totalW = float(getNumLeafs(inTree))
    plotTree.totalD = float(getTreeDepth(inTree))
    plotTree.xOff = -0.5 / plotTree.totalW;
    plotTree.yOff = 1.0;
    plotTree(inTree, (0.5, 1.0), '')
    plt.show()


if __name__ == '__main__':
    myTree = retrieveTree(0)
    myTree['no surfacing'][3] = 'maybe'
    createPlot(myTree)
def set_ch():
    from pylab import mpl
    mpl.rcParams['font.sans-serif'] = ['FangSong']  # 指定默认字体
    mpl.rcParams['axes.unicode_minus'] = False  # 解决保存图像是负号'-'显示为方块的问题
ps:一篇python常见错误
http://blog.csdn.net/Felaim/article/details/69236154?fps=1&locationNum=14