它主要用于反映原始数据分布的特征,还可以进行多组数据分布特征的比较
如何利用Python绘制箱型图
需要的import的包
1 import matplotlib.pyplot as plt
2 from matplotlib.font_manager import FontProperties
3 import numpy as np
4 import pandas as pd
该函数是绘制多箱型图,且数据长度不一致的情况,input_dict = {filename1:[a1,a2,...,an],filename2:[b1,b2,...,bn]...} Y_label = 'Img_name'
 1 def DrawMultBoxPic(input_dict,Y_label):
 2     dict_list_length = []
 3     for item in input_dict:
 4         temp_length = len(input_dict[item])
 5         dict_list_length.append(temp_length)
 6     # 获取最长列表长度
 7     max_length = max(dict_list_length)
 8     # 每个列表在后面追加None
 9     for item in input_dict:
10         diff_length = max_length - len(input_dict[item])
11         if diff_length > 0:
12             for i in range(diff_length):
13                 input_dict[item].append(None)
14         # else:
15             # print('{}文件列表长度最长'.format(item))
16     # 绘制箱型图
17     zhfont = FontProperties(fname='C:/Windows/Fonts/simsun.ttc', size=16)
18     data = pd.DataFrame.from_dict(input_dict)
19     data.boxplot(widths=0.3,figsize=(30,15),fontsize=16)
20     plt.xlabel(u'煤质文件名称', fontproperties=zhfont)
21     plt.ylabel(Y_label, fontproperties=zhfont)
22     plt.title(Y_label, fontproperties=zhfont)
23     # plt.axis([0, 6, 0, 90])
24     plt.grid(axis='y', ls='--', lw=2, color='gray', alpha=0.4)
25     plt.grid(axis='x', ls='--', lw=2, color='gray', alpha=0.4)
26     imgname = 'E:\' + Y_label + '.png'
27     plt.savefig(imgname, bbox_inches = 'tight')
28     # plt.show()
结果显示

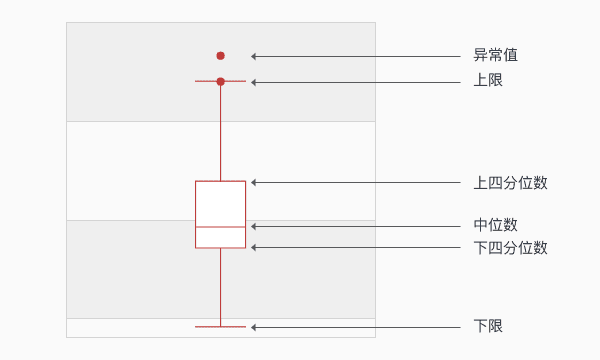
如何获取箱型图特征
 1 """
 2 【函数说明】获取箱体图特征
 3 【输入】 input_list 输入数据列表
 4 【输出】 out_list:列表的特征[下限,Q1,Q2,Q3,上限] 和 Error_Point_num:异常值数量
 5 【版本】 V1.0.0
 6 【日期】 2019 10 16
 7 """
 8 def BoxFeature(input_list):
 9     # 获取箱体图特征
10     percentile = np.percentile(input_list, (25, 50, 75), interpolation='linear')
11     #以下为箱线图的五个特征值
12     Q1 = percentile[0]#上四分位数
13     Q2 = percentile[1]
14     Q3 = percentile[2]#下四分位数
15     IQR = Q3 - Q1#四分位距
16     ulim = Q3 + 1.5*IQR#上限 非异常范围内的最大值
17     llim = Q1 - 1.5*IQR#下限 非异常范围内的最小值
18     # llim = 0 if llim < 0 else llim
19     # out_list = [llim,Q1,Q2,Q3,ulim]
20     # 统计异常点个数
21     # 正常数据列表
22     right_list = []
23     Error_Point_num = 0
24     value_total = 0
25     average_num = 0
26     for item in input_list:
27         if item < llim or item > ulim:
28             Error_Point_num += 1
29         else:
30             right_list.append(item)
31             value_total += item
32             average_num += 1
33     average_value =  value_total/average_num
34     # 特征值保留一位小数
35     out_list = [average_value,min(right_list), Q1, Q2, Q3, max(right_list)]
36     # print(out_list)
37     out_list = Save1point(out_list)
38     return out_list,Error_Point_num