python机器学习-乳腺癌细胞挖掘(博主亲自录制视频)
https://study.163.com/course/introduction.htm?courseId=1005269003&utm_campaign=commission&utm_source=cp-400000000398149&utm_medium=share
机器学习,统计项目联系QQ:231469242
两个配对样本,均匀分布,非正太分布
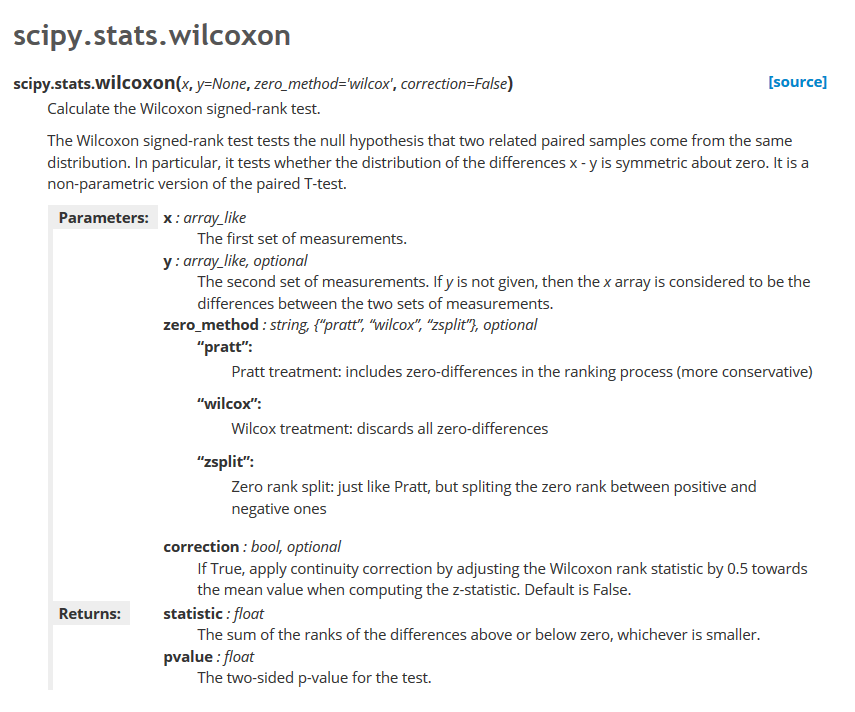
Wilcoxon signed-rank test
曼-惠特尼U检验Mann–Whitney Test
两个独立样本,均匀分布,非正太分布
https://en.wikipedia.org/wiki/Frank_Wilcoxon


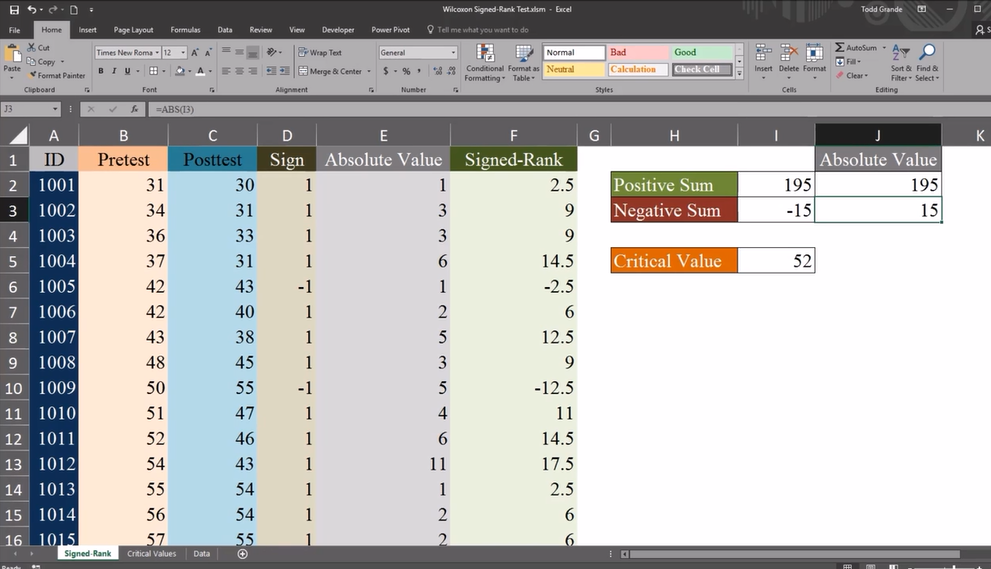
ranking method
这是a=0.05对应得样本数
critical value 对应样本数,20样本对应的关键值为52

positive sum:
差异为正值的排名和
negative sum:
差异为负值的排名和
如果negative sum小于52,表明两组数有显著差异,推翻原假设

http://blog.sina.com.cn/s/blog_4bcf5ebd0101422n.html
SPSS学习笔记之——两配对样本的非参数检验(Wilcoxon符号秩检验)
一、概述
非参数检验对于总体分布没有要求,因而使用范围更广泛。对于两配对样本的非参数检验,首选Wilcoxon符号秩检验。它与配对样本t检验相对应。
二、问题
为了研究某放松方法(如听音乐)对于入睡时间的影响,选择了10名志愿者,分别记录未进行放松时的入睡时间及放松后的入睡时间(单位为分钟),数据如下笔。请问该放松方法对入睡时间有无影响。
本例可以采用配对样本t检验,但由于样本量少,数据可能不符合正太分布,所以考虑用非参数检验。
三、统计操作
数据视图
菜单选择
打开如下的对话框
该对话框有三个选项卡,第一个选项卡会根据第三个选项卡的设置自动设置,故一般不用手动设定。点击进入“字段”选项卡。将“放松前”、“放松后”均选入右边“检验字段”框中。
点击进入“设置”对话框,选择检验方法,切换为“自定义检验”,选择“Wilcoxon匹配样本对符号秩(二样本)”复选框。“检验选项”可以设定显著性水平。
点击“运行”按钮,输出结果
这就是输出结果。原假设示放松前好放松后差值的中位数等于0,P=0.015<0.05,拒绝原假设,认为放松前后有统计学差异。
双击该表格,会弹出如下的“模型浏览器”窗口,可以看到更详细的信息。如下图。
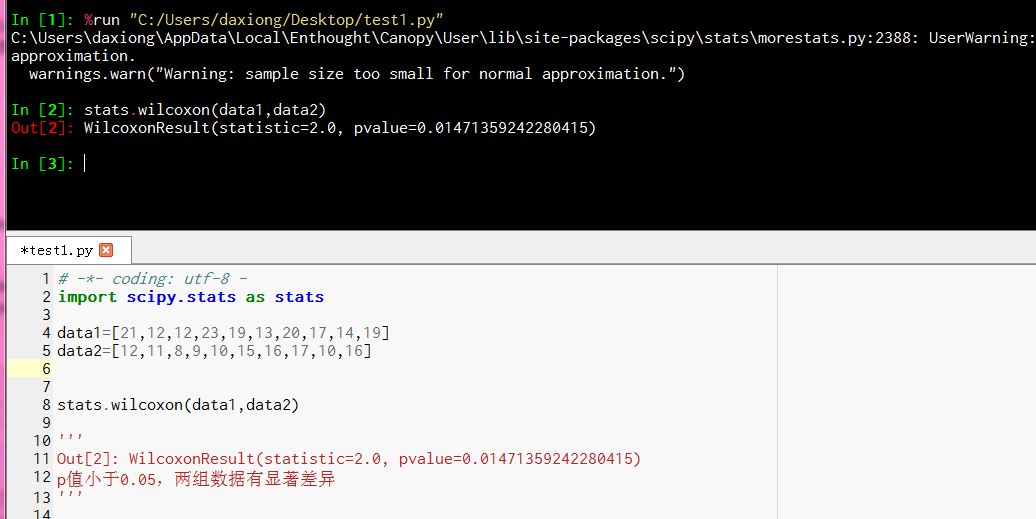
# -*- coding: utf-8 -
import scipy.stats as stats
data1=[21,12,12,23,19,13,20,17,14,19]
data2=[12,11,8,9,10,15,16,17,10,16]
stats.wilcoxon(data1,data2)
'''
Out[2]: WilcoxonResult(statistic=2.0, pvalue=0.01471359242280415)
p值小于0.05,两组数据有显著差异
'''

https://study.com/academy/lesson/non-parametric-inferential-statistics-definition-examples.html
Normal
What is normal? At least in the world of statistics, this has nothing to do with how someone dresses, acts, or what their beliefs are. Normal data comes from a population with a normal distribution. A normal distribution is a distribution that has a symmetrical bell-shaped curve to it, which you're probably well aware of.
Keep this concept in mind as we go over the major differences between parametric and non-parametric statistics.
Parametric Methods
First, let's define our terms really simply. When we talk about parameters in statistics, what are we actually hinting at? Parameters are descriptive measures of population data, such as the population mean or population standard deviation.
When the variable we are considering is approximately (or completely) normally distributed, or the sample size is large, we can use two inferential methods that are concerned with parameters - appropriately called parametric methods - when performing a hypothesis test for a population mean. For instance, if we find that the distribution of the average salary of a sample looks like a bell curve, then parametric methods may be used.
These two methods are probably ones you've heard of before. They are the z-test, which we'd use when the population standard deviation is known to us; or the t-test, which we'd use when the population standard deviation is not known to us.
Non-Parametric Methods
Inferential methods that are not concerned with parameters are known, easily enough, as non-parametric methods. However, this term is also more broadly used to refer to many methods that are applied without assuming normality. So, for instance, if we find that the distribution of the average salary of a sample looks like the histogram you see on the screen now [see video], which is nothing close to that of a bell curve, then we will have to turn to non-parametric methods.
Such non-parametric methods have their pros and cons. On the pro side, these methods are usually simpler to compute and are more resistant to extreme values when compared to parametric methods. On the con side, if the requirements for the use of a parametric method are actually met, non-parametric methods do not have as much power as the z-test or t-test.
By power, I simply mean the probability of avoiding a type II error, which is an error where we fail to reject the false null hypothesis.
Example of a Non-Parametric Method
One example of a non-parametric method is the Wilcoxon signed-rank test. This is a test that assumes the variable under consideration does not need a specific shape and doesn't have to be normally distributed, but is symmetric in its distribution nonetheless. This means that it can be sliced in half to produce two mirror images.
So, for example, a right-skewed or left-skewed distribution would not be appropriate for this test since it's not symmetric. But a normal, symmetric bimodal, triangular, or uniform distribution would be a fit for this test since any one of those can be sliced in half to produce two mirror images of one another.
Other non-parametric tests include the likes of:
- The Kruskal-Wallis test
- The Mann-Whitney U test
- The sign test
Lesson Summary
Normal data comes from a population with a normal distribution. A normal distribution is a distribution that has a symmetrical bell-shaped curve to it, which you're probably well aware of.
Inferential methods that are concerned with parameters are appropriately called parametric methods, and include the z-test and t-test. Parameters are descriptive measures of population data.
Inferential methods that are not concerned with parameters are known as non-parametric methods. This term is also more broadly used to refer to many methods that are applied without assuming normality.
While non-parametric methods are easier to compute than parametric ones, they do not have as much power as parametric methods if the requirements for the use of a parametric method are met. By power, I simply mean the probability of avoiding a type II error, which is an error where we fail to reject the false null hypothesis.
An example of a non-parametric method is the Wilcoxon signed-rank test. This is a test that assumes the variable under consideration does not need a specific shape and doesn't have to be normally distributed, but is symmetric in its distribution nonetheless.

