https://study.163.com/provider/400000000398149/index.htm?share=2&shareId=400000000398149( 欢迎关注博主主页,学习python视频资源,还有大量免费python经典文章)

医药统计项目QQ:231469242
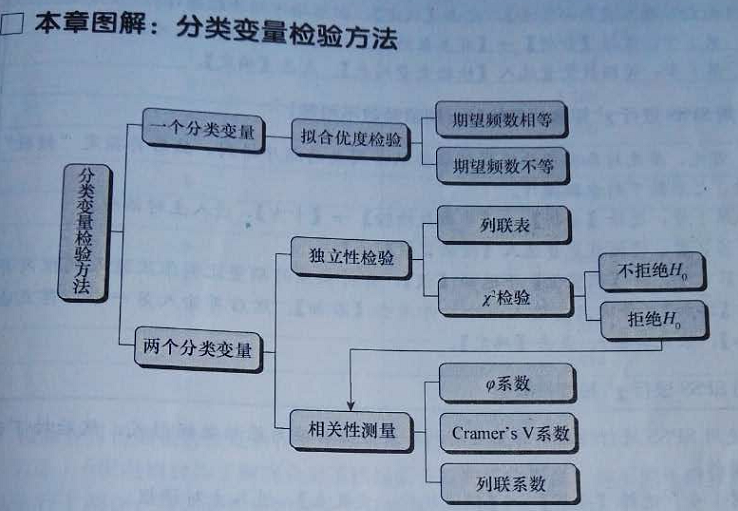
分类变量检验方法

卡方分布绘图
如果多个符合正态分布的独立随机变量z1,z2,z3.....zk,
z1+z2+z3+....z_k呈现卡方分布,自由度k.
有几个正态分布相加,就有几个自由度


# -*- coding: utf-8 -*-
# Toby QQ:231469242
import numpy as np
import matplotlib.pyplot as plt
import scipy.stats as stats
import seaborn as sns
import math,pylab,matplotlib,numpy
from matplotlib.font_manager import FontProperties

#设置中文字体
font=FontProperties(fname=r"c:windowsfontssimsun.ttc",size=15)

n=10

#绘制自由度为n的卡方分布图,n表示生成卡方数组的个数
def Get_chisquareDatas(n):
    #标准正太分布
    normalDistribution=stats.norm(0,1)
    list_data=[]
    for i in range(n):
        normal_data=normalDistribution.rvs(30)
        chisquare_data=normal_data**2
        list_data.append(chisquare_data)
    return list_data

def Plot_chisquare(n):
    list_data=Get_chisquareDatas(n)
    sum_data=sum(list_data)
    plt.hist(sum_data)

Plot_chisquare(2)
Plot_chisquare(3)
Plot_chisquare(10)
官方绘图代码

# -*- coding: utf-8 -*-

from scipy.stats import chi2
import matplotlib.pyplot as plt
import numpy as np
fig, ax = plt.subplots(1, 1)

df = 20
mean, var, skew, kurt = chi2.stats(df, moments='mvsk')

#绘制函数的起始点和终止点
#pdf为概率密度函数
#百分比函数(PPF) :the inverse of the CDF. PPF  函数和连续分布函数CDF相逆,
#比如输入哪一个点,可以得到低于等于20的概率?
#ppf(0.01, df)表示输入哪个点,得到概率低于0.01
initial=chi2.ppf(0.01, df)
end=chi2.ppf(0.99, df)
x = np.linspace(initial,end, 100)

#概率密度函数用于绘图
ax.plot(x, chi2.pdf(x, df), 'r-', lw=5, alpha=0.6, label='chi2 pdf')
plt.title("df is %d"%df)
plt.show()
卡方检验代码
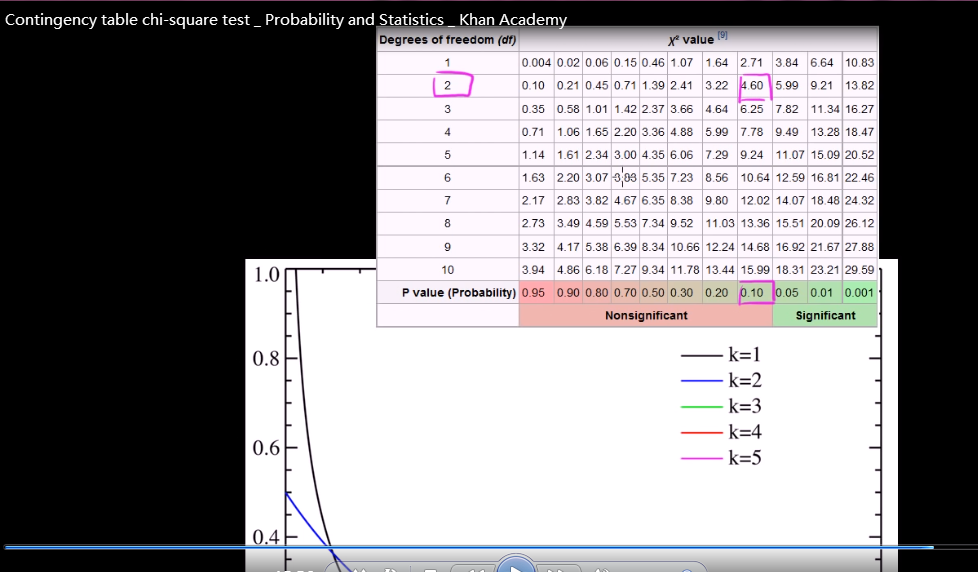
可汗学院的问题
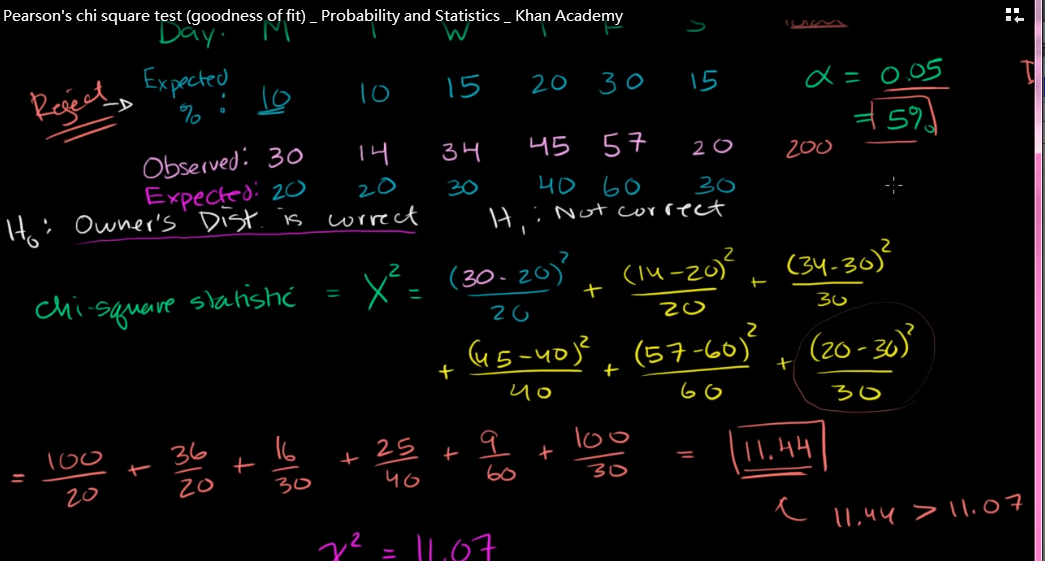
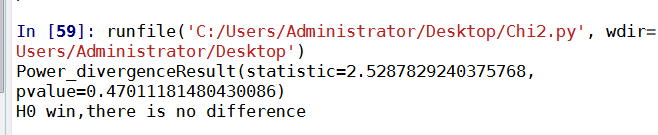
# -*- coding: utf-8 -*-
'''
卡方公式(o-e)^2 / e
期望值和收集到数据不能低于5,o(observed)观察到的数据,e(expected)表示期望的数据
(o-e)平方,最后除以期望的数据e
'''

import numpy as np
from scipy import stats
from scipy.stats import chisquare
list_observe=[30,14,34,45,57,20]
list_expect=[20,20,30,40,60,30]


std=np.std(data,ddof=1)
print(chisquare(f_obs=list_observe, f_exp=list_expect))
p=chisquare(f_obs=list_observe, f_exp=list_expect)[1]
'''
返回NAN,无穷小
'''

if p>0.05 or p=="nan":
   print"H0 win,there is no difference"
else:
   print"H1 win,there is difference"
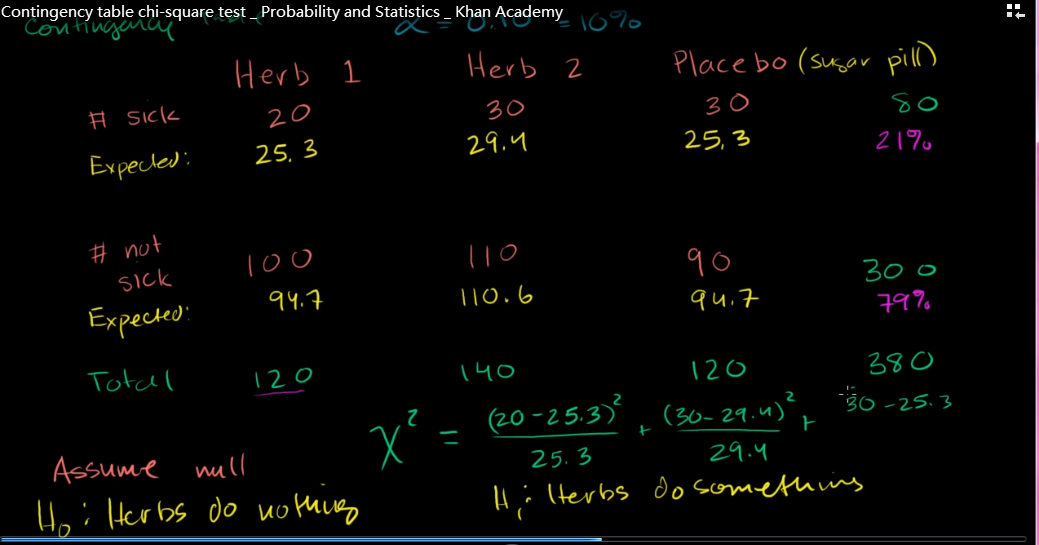
contigency table联立表
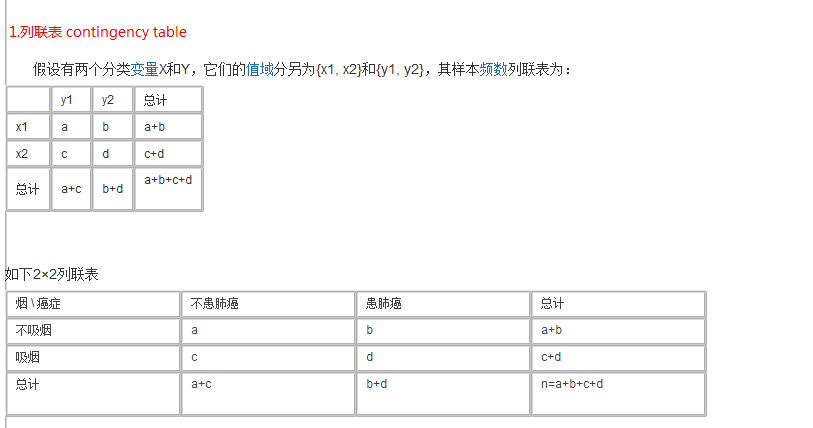
测试数据
第一行:草本药1,草本药2,安慰剂
第二行:生病和非生病
H0:草本药和疾病无关系
H1:草本药和疾病有关系
可汗学院计算出来的卡方值2.53;自由度2,显著性0.1,的关键值4.6
卡方值2.53<关键值4.6, H0成立,两者无关系
python代码与可汗学院算出结果一致,此版本体现算法推导过程。缺点就是要自己计算出期望值列表
# -*- coding: utf-8 -*-
'''
卡方公式(o-e)^2 / e
期望值和收集到数据不能低于5,o(observed)观察到的数据,e(expected)表示期望的数据
(o-e)平方,最后除以期望的数据e
联立表contigency table计算
'''

from scipy.stats import chisquare

list_observe=[34,38,28,50]
list_expect=[29.76,42.2,32.24,45.77]

row=2
colume=2


def Contigency_table(row,colume,list_observe,list_expect):
    degreeFreedom=(row-1)*(colume-1)
    print(chisquare(f_obs=list_observe, f_exp=list_expect,ddof=degreeFreedom))
    p=chisquare(f_obs=list_observe, f_exp=list_expect)[1]


    if p>0.05 or p=="nan":
       print"H0 win,there is no difference"
    else:
       print"H1 win,there is difference"

Contigency_table(row,colume,list_observe,list_expect)
此版本不用算出期望值,更加方便,参考的是2*2联立表,自由度=1,critical value=2.7
# -*- coding: utf-8 -*-

#独立性检验test for independence,也是卡方检验chi_square
#前提条件:a,b,c,d 必须大于5

#2.706是判断标准(90概率),值越大,越有关,值越小,越无关
def value_independence(a,b,c,d):
    if a>=5 and b>=5 and c>=5 and d>=5:
        return ((a+b+c+d)*(a*d-b*c)**2)/float((a+b)*(c+d)*(a+c)*(b+d))

#返回True表示有关
#返回False表示无关
def judge_independence(num_independence):
    if num_independence>2.706:
        print ("there is relationship")
        return True
    else:
        print("there is no relationship")
        return False

a=34
b=38
c=28
d=50
chi_square=value_independence(a,b,c,d)
relation=judge_independence(chi_square)
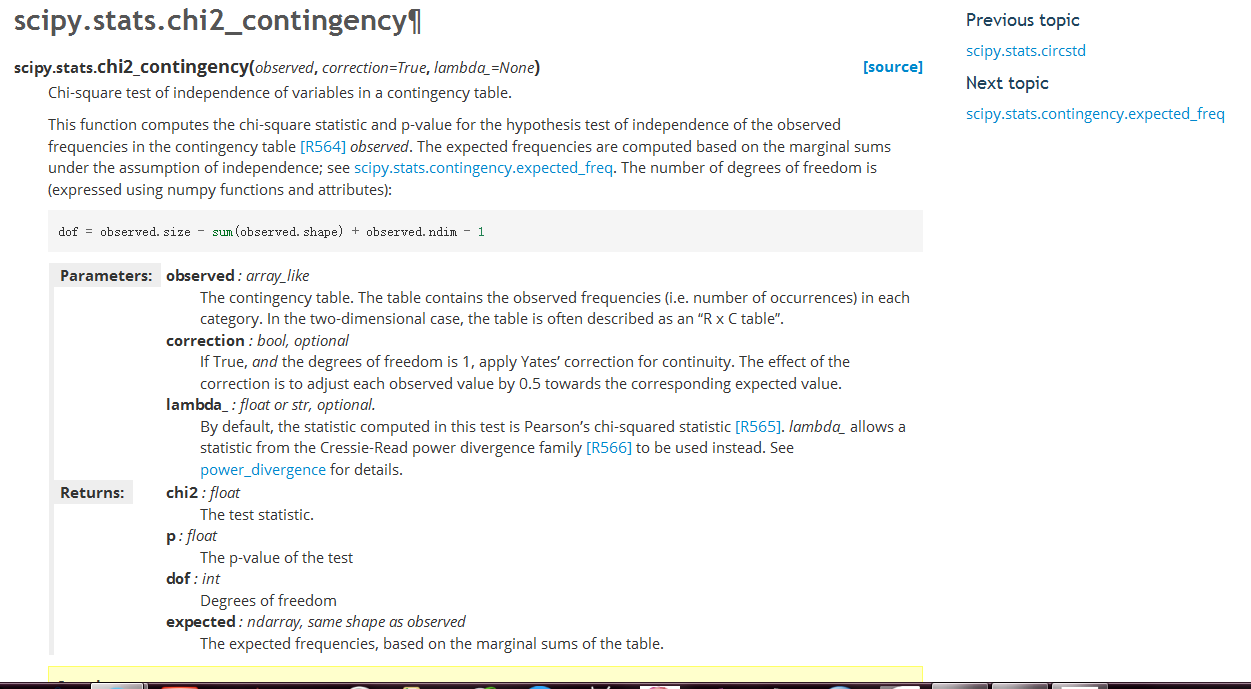
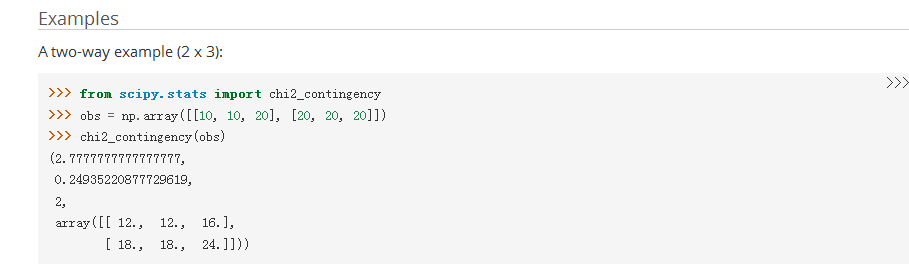
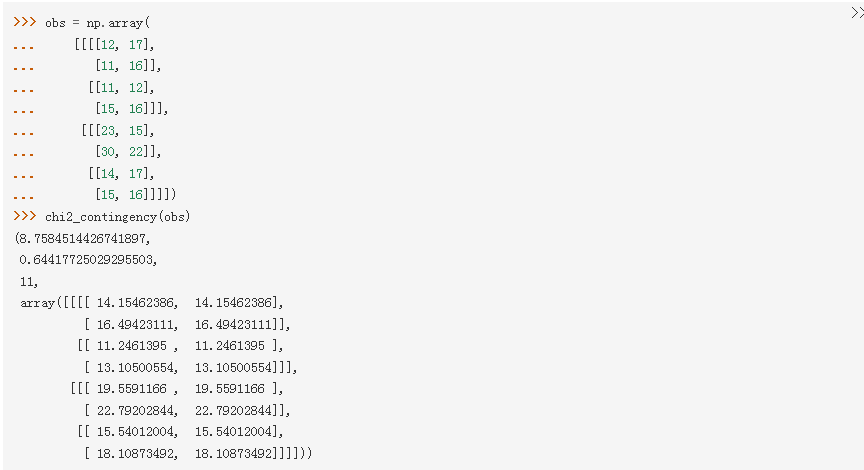
python官网版本,更加方便和科学
https://docs.scipy.org/doc/scipy/reference/generated/scipy.stats.chi2_contingency.html
import scipy.stats as stats

data = np.array([[43,9],
[44,4]])
V, p, dof, expected = stats.chi2_contingency(data)
print(p)
python机器学习-乳腺癌细胞挖掘(博主亲自录制视频)
https://study.163.com/course/introduction.htm?courseId=1005269003&utm_campaign=commission&utm_source=cp-400000000398149&utm_medium=share
