# -*- coding: utf-8 -*-
'''
python入门/爬虫/人工智能/机器学习/自然语言/数据统计分析视频教程网址
https://pythoner.taobao.com/
https://github.com/thomas-haslwanter/statsintro_python/tree/master/ISP/Code_Quantlets/12_Multivariate/multipleRegression
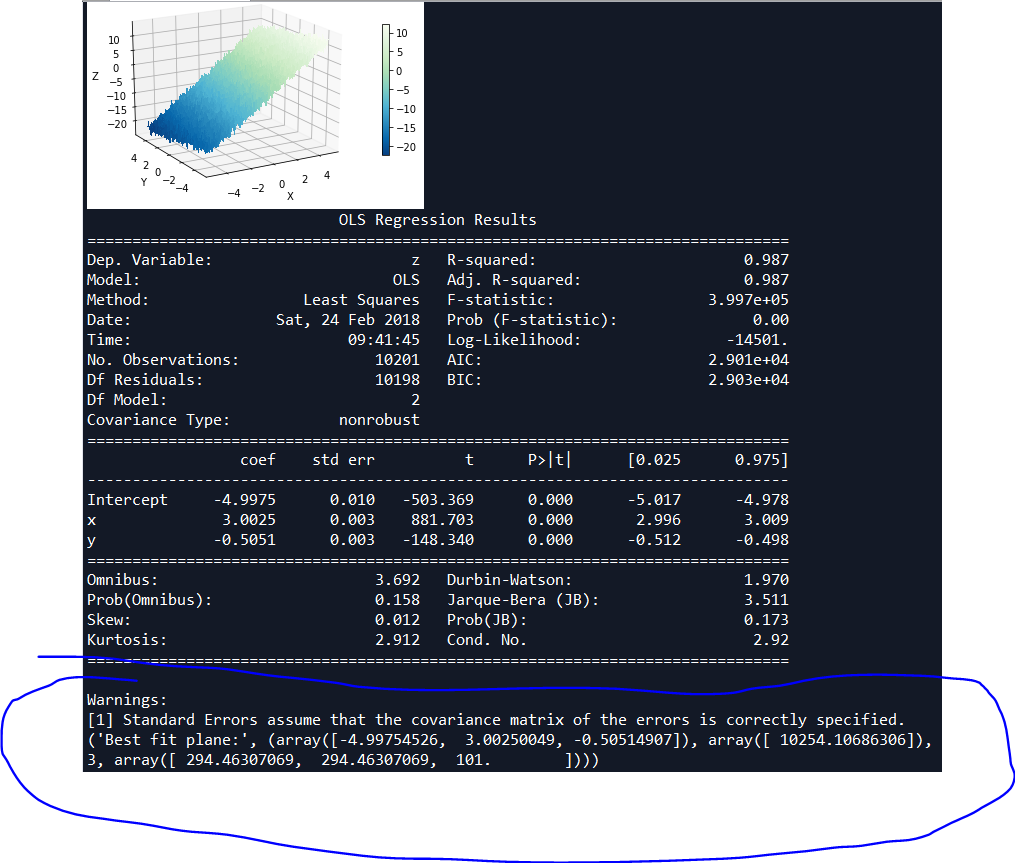
Multiple Regression
- Shows how to calculate the best fit to a plane in 3D, and how to find the
corresponding statistical parameters.
- Demonstrates how to make a 3d plot.
- Example of multiscatterplot, for visualizing correlations in three- to
six-dimensional datasets.
'''
# Import standard packages
import numpy as np
import matplotlib.pyplot as plt
import pandas as pd
import seaborn as sns
# additional packages
import sys
import os
sys.path.append(os.path.join('..', '..', 'Utilities'))
try:
# Import formatting commands if directory "Utilities" is available
from ISP_mystyle import showData
except ImportError:
# Ensure correct performance otherwise
def showData(*options):
plt.show()
return
# additional packages ...
# ... for the 3d plot ...
from mpl_toolkits.mplot3d import Axes3D
from matplotlib import cm
# ... and for the statistic
from statsmodels.formula.api import ols
def generateData():
''' Generate and show the data: a plane in 3D '''
#随机产生101个数据,取值范围从(-5到5)
x = np.linspace(-5,5,101)
(X,Y) = np.meshgrid(x,x)
# To get reproducable values, I provide a seed value
np.random.seed(987654321)
#np.random.randn产生随机的正太分布数,np.shape(X)表示X的size(101,101)
#np.random.randn(np.shape(X)[0], np.shape(X)[1])表示产生(101,101)个随机数
Z = -5 + 3*X-0.5*Y+np.random.randn(np.shape(X)[0], np.shape(X)[1])
# 绘图
#Set the color
myCmap = cm.GnBu_r
# If you want a colormap from seaborn use:
#from matplotlib.colors import ListedColormap
#myCmap = ListedColormap(sns.color_palette("Blues", 20))
# Plot the figure
fig = plt.figure()
ax = fig.gca(projection='3d')
surf = ax.plot_surface(X,Y,Z, cmap=myCmap, rstride=2, cstride=2,
linewidth=0, antialiased=False)
ax.view_init(20,-120)
ax.set_xlabel('X')
ax.set_ylabel('Y')
ax.set_zlabel('Z')
fig.colorbar(surf, shrink=0.6)
outFile = '3dSurface.png'
showData(outFile)
#X.flatten()把多维数据展开,弄成一维数据
return (X.flatten(),Y.flatten(),Z.flatten())
def regressionModel(X,Y,Z):
'''Multilinear regression model, calculating fit, P-values, confidence intervals etc.'''
# Convert the data into a Pandas DataFrame
df = pd.DataFrame({'x':X, 'y':Y, 'z':Z})
# --- >>> START stats <<< ---
# Fit the model
model = ols("z ~ x + y", df).fit()
# Print the summary
print((model.summary()))
# --- >>> STOP stats <<< ---
return model._results.params # should be array([-4.99754526, 3.00250049, -0.50514907])
#用numpy的线性回归模型,和上面regressionModel函数计算结果一致
def linearModel(X,Y,Z):
'''Just fit the plane, using the tools from numpy'''
# --- >>> START stats <<< ---
M = np.vstack((np.ones(len(X)), X, Y)).T
bestfit = np.linalg.lstsq(M,Z)
# --- >>> STOP stats <<< ---
print(('Best fit plane:', bestfit))
return bestfit
if __name__ == '__main__':
(X,Y,Z) = generateData()
regressionModel(X,Y,Z)
linearModel(X,Y,Z)