import numpy as np
import matplotlib.pyplot as plt
from matplotlib.colors import ListedColormap
from sklearn import datasets
from sklearn.neighbors import KNeighborsClassifier
iris = datasets.load_iris()
x = iris.data[:,:2]
y = iris.target
x_min,x_max = x[:,0].min() - .5,x[:,0].max() + .5
y_min,y_max = x[:,1].min() - .5,x[:,1].max() + .5
cmap_light = ListedColormap(['#AAAAFF','#AAFFAA','#FFAAAA'])
h = .02
xx,yy = np.meshgrid(np.arange(x_min,x_max,h),np.arange(y_min,y_max,h))
knn = KNeighborsClassifier()
knn.fit(x,y)
Z = knn.predict(np.c_[xx.ravel(),yy.ravel()])
Z = Z.reshape(xx.shape)
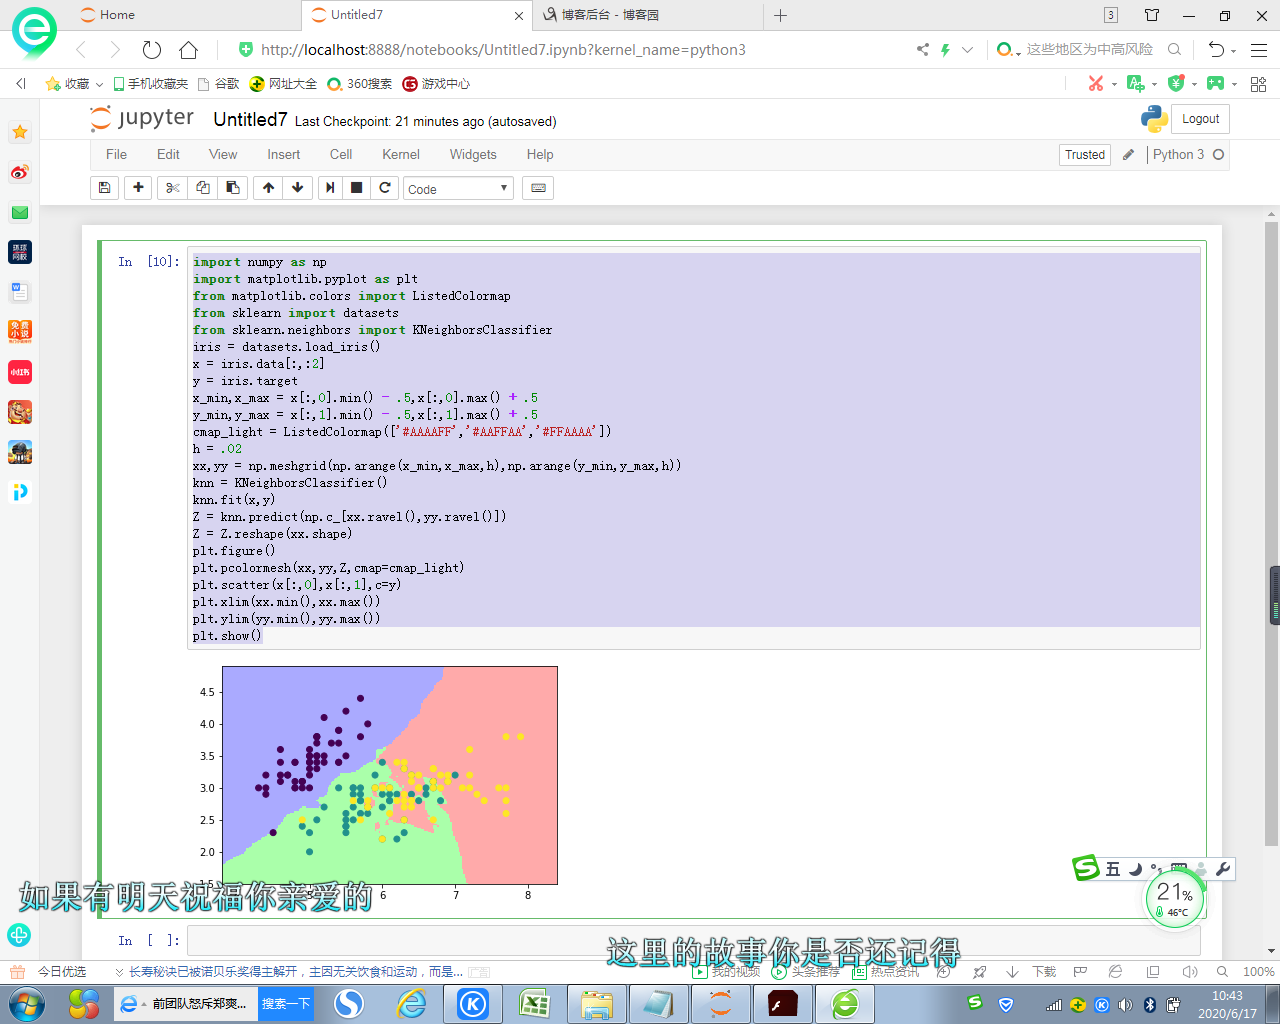
plt.figure()
plt.pcolormesh(xx,yy,Z,cmap=cmap_light)
plt.scatter(x[:,0],x[:,1],c=y)
plt.xlim(xx.min(),xx.max())
plt.ylim(yy.min(),yy.max())
plt.show()