前言
首先介绍一下目前监控案例都是基于zabbix4.0版本进行讲解,但是也会对zabbix4.0与新出的zabbix5.0直接实现的差异进行讲解说明,方便升级至zabbix5.0后对有些功能直接使用。
参考链接:nginx配置参考
一、首先我们先来讲解一下zabbix5.0版本对nginx是如何实现监控的。
zabbix5.0提供了对nginx的监控模板,该模板无需任何外部脚本即可工作。借助zabbix批量数据收集功能,大多数指标可以一次性收集。
通过使用zabbix agent在本地轮询ngx_http_stub_status_module来收集指标:
Active connections: 291
server accepts handled requests
16630948 16630948 31070465
Reading: 6 Writing: 179 Waiting: 106
请注意,该模板不支持https和重定向
他还使用zabbix agent收集nginx linux进程统计信息,例如CPU使用率,内存使用率以及进程是否在运行。
配置nginx status模块,配置示例如下:如果您使用其他位置,请不要忘记更改{$ NGINX.STUB_STATUS.PATH}宏。
location = /basic_status {
    stub_status;
    allow 127.0.0.1;
    allow ::1;
    deny all;
}
items 集
| Group | Name | Description | Key and additional info |
| Nginx | Nginx:Service status | 用于测试127.0.0.1本机的http服务是否可用 | net.tcp.service[http,127.0.0.1,80] |
| Nginx | Nginx:Service response time | 用于测试http服务的初始响应速度,秒为单位 | net.tcp.service.perf[http,127.0.0.1,80] |
| Nginx | Nginx: Number of processes running | 正在运行的Nginx进程数 | proc.num[nginx] |
| Nginx | Nginx: Memory usage (vsize) | 进程使用的虚拟内存大小(以字节为单位) | proc.mem[nginx,,,,vsize] |
| Nginx | Nginx: Memory usage (rss) | 进程使用的驻留集大小内存(以字节为单位) | proc.mem[nginx,,,,rss] |
| Nginx | Nginx: Memory usage (pmem) | 进程内存利用率百分比 | proc.mem[nginx,,,,pmem] |
| Nginx | Nginx: CPU utilization | 进程CPU利用率百分比 | proc.cpu.util[nginx] |
| Zabbix_raw_items | Nginx: Get stub status page |
The following status information is provided: Active connections - the current number of active client connections including Waiting connections. Accepts - the total number of accepted client connections. Handled - the total number of handled connections. Generally, the parameter value is the same as accepts unless some resource limits have been reached (for example, the worker_connections limit). Requests - the total number of client requests. Reading - the current number of connections where nginx is reading the request header. Writing - the current number of connections where nginx is writing the response back to the client. Waiting - the current number of idle client connections waiting for a request. |
web.page.get[http://127.0.0.1/status] |
| Nginx | Nginx: Requests total | The total number of client requests. | nginx.requests.total
Preprocessing: - REGEX: |
| Nginx | Nginx: Requests per second | The total number of client requests. | nginx.requests.total.rate
Preprocessing: - REGEX: - CHANGE_PER_SECOND |
| Nginx | Nginx: Connections accepted per second | The total number of accepted client connections. | nginx.connections.accepted.rate
Preprocessing: - REGEX: - CHANGE_PER_SECOND |
| Nginx | Nginx: Connections dropped per second | The total number of dropped client connections. | nginx.connections.dropped.rate
Preprocessing: - JAVASCRIPT: - CHANGE_PER_SECOND |
| Nginx | Nginx: Connections handled per second | The total number of handled connections. Generally, the parameter value is the same as accepts unless some resource limits have been reached (for example, the worker_connections limit). | nginx.connections.handled.rate
Preprocessing: - REGEX: - CHANGE_PER_SECOND |
| Nginx | Nginx: Connections active | The current number of active client connections including Waiting connections. | nginx.connections.active
Preprocessing: - REGEX: |
| Nginx | Nginx: Connections reading | The current number of connections where nginx is reading the request header. | nginx.connections.reading
Preprocessing: - REGEX: |
| Nginx | Nginx: Connections waiting | The current number of idle client connections waiting for a request. | nginx.connections.waiting
Preprocessing: - REGEX: |
| Nginx | Nginx: Connections writing | The current number of connections where nginx is writing the response back to the client. | nginx.connections.writing
Preprocessing: - REGEX: |
| Nginx | Nginx: Version | nginx.version
Preprocessing: - REGEX: - DISCARD_UNCHANGED_HEARTBEAT: |
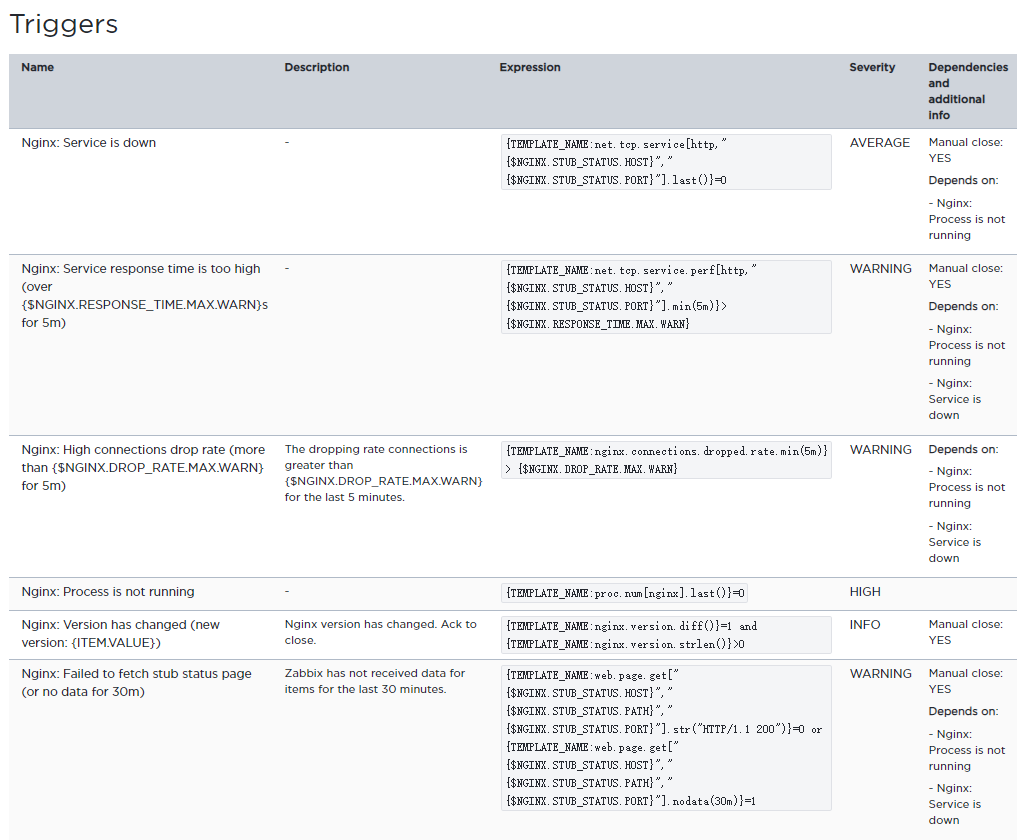
触发器配置:
nginx监控脚本经供参考:


 1 shell# vim /etc/nginx/conf.d/monitor.conf #/etc/nginx是配置目录
 2 server {
 3         listen 127.0.0.1:80;
 4         server_name 127.0.0.1;
 5         location /nginxstatus {
 6         stub_status on;
 7         access_log off;
 8         allow 127.0.0.1;            #这里是允许的IP地址
 9         deny all;
10         }
11 }
12 shell# nginx -t  #如果输出错误,请检查配置文件
13 nginx: the configuration file etc/nginx/nginx.conf syntax is ok
14 nginx: configuration file/etc/nginx/nginx.conf test is successful
15 shell# nginx -s reload  #测试配置是否正确
16
17
18 ========================================================
19
20
21 Nginx监控脚本如下:
22
23 shell# vim /etc/zabbix/scripts/nginx_status
24 #!/bin/bash
25
26 # function:monitor nginx  from zabbix
27 # License: GPL
28 # mail: itnihao@qq.com
29 # version 1.0 date:2012-12-09
30 # version 1.0 date:2013-01-15
31 # version 1.1 date:2014-09-05
32
33 source /etc/bashrc >/dev/null 2>&1
34 source /etc/profile  >/dev/null 2>&1
35 nginxstatus=http://127.0.0.1/nginxstatus
36
37 # Functions to return nginx stats
38 function checkavailable {
39     code=$(curl -o /dev/null -s -w %{http_code} ${nginxstatus})
40     if [ "${code}" == "200" ];then
41         return 1
42     else
43         echo  0
44     fi
45 }
46 function active {
47     checkavailable|| curl -s "${nginxstatus}" | grep 'Active' | awk '{print $3}'
48 }
49 function reading {
50     checkavailable|| curl -s "${nginxstatus}" | grep 'Reading' | awk '{print $2}'
51 }
52 function writing {
53     checkavailable|| curl -s "${nginxstatus}" | grep 'Writing' | awk '{print $4}'
54 }
55 function waiting {
56     checkavailable|| curl -s "${nginxstatus}" | grep 'Waiting' | awk '{print $6}'
57 }
58 function accepts {
59     checkavailable|| curl -s "${nginxstatus}" | awk NR==3 | awk '{print $1}'
60 }
61 function handled {
62     checkavailable|| curl -s "${nginxstatus}" | awk NR==3 | awk '{print $2}'
63 }
64 function requests {
65     checkavailable|| curl -s "${nginxstatus}" | awk NR==3 | awk '{print $3}'
66 }
67
68 case "$1" in
69     active)
70         active
71         ;;
72     reading)
73         reading
74         ;;
75     writing)
76         writing
77         ;;
78     waiting)
79         waiting
80         ;;
81     accepts)
82         accepts
83        ;;
84     handled)
85         handled
86         ;;
87     requests)
88         requests
89         ;;
90     *)
91         echo "Usage: $0 {active |reading |writing |waiting |accepts |handled |requests }"
92 esac