技巧一:运行时修改变量的值
你以前怎么验证是不是某个变量的值导致整段程序不能正常工作?修改代码中的变量的值,然后cmd+r重新启动app?现在你不需要这么做了,只需要设置一个断点,当程序在这进入调试模式后,使用expr命令即可在运行时修改变量的值。
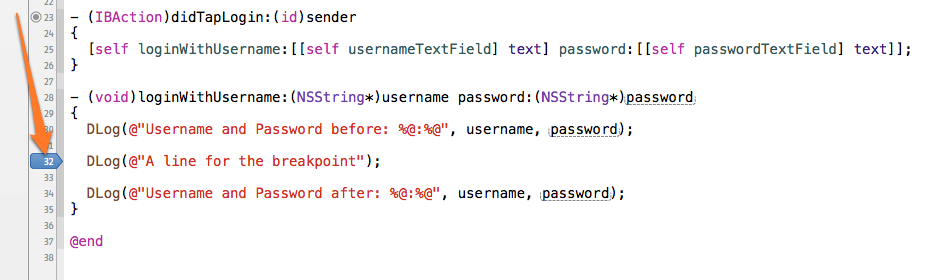
假如有一个loginWithUsername:方法,需要两个参数:username,password。
首先设置好断点,如下图所示:
运行app,进入断点模式后,在(lldb)后输入
|
1
2
|
expr username = @"username"expr password = @"badpassword" |
控制台会返回以下信息
|
1
2
|
(NSString *) $0 = 0x3d3504c4 @"username"(NSString *) $1 = 0x1d18ef60 @"badpassword" |
现在跳出断点,执行断点之后的两条输出语句,控制台会有以下输出
|
1
2
|
(0x1c59aae0) A line for the breakpoint(0x1c59aae0) Username and Password after: username:badpassword |
看到看吧,我们在运行时修改了变量的值,事情还可以变的更简单一些,我们可以编辑断点,让它自动填充需要的修改的变量的值,并且可以选择在此断点处不进入断点模式,仅仅修改指定变量的值,然后自动执行后续代码。
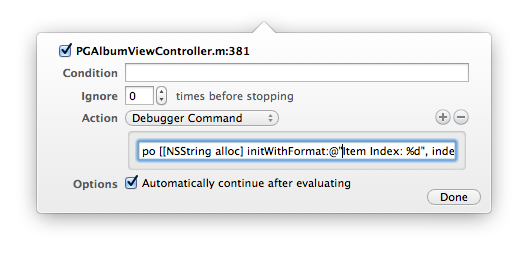
右击断点选择“Edit Breakpoint...”(或者按住cmd+option,单击断点),然后如下图所示设置断点

注意选中了最后一行(“Automatically continue after evaluating”)的选择框,这就保证运行到这个断点的时,填充变量的值,然后继续运行,并不在此处断点进入调试模式。
运行app,你会得到和上述手动设置变量的值一样的输出。
接下来单击断点,使其处于禁用状态,现在箭头的颜色应该是浅蓝色的,重新运行app,你会发现username和password的值没有在运行时被改变了。
技巧二:设置断点触发条件
断点的另外一个重要作用,是可以设置触发断点生效的条件,这样我们就可以在运行时针对特定的数据进行分析,观察app是否运行在正确的轨道上。如下图:

上述截图可以看到如下语句
|
1
|
(BOOL)[(NSString*)[item valueForKey:@"ID"] isEqualToString:@"93306"] |
通过这行语句,我们告诉编译器:当item中ID等于93306时,此断点生效,进入断点调试模式。
技巧三:格式化输出数据
如果你厌倦了代码里无穷无尽的NSLog,幸运的是我们可以在编辑断点使其输出格式化字符串就像平常编码时一样。不过有一点需要注意,平常编码时可能会使用NSString‘s stringWithFormat:输出格式化字符串,不过这个方法貌似在断点中木有效果,你需要使用alloc/init形式的方法,如下:
|
1
|
po [[NSString alloc] initWithFormat:@"Item index is: %d", index] |
运行app,就能在控制台看到想要的输出啦!
简单!强大!这就是LLDB给你的选择,从此代码里可以不用再有NSLog满天飞的情况了,代码变得更干净了,心情变得更愉悦了!
LLDB还有很多强大的地方,本教程只不过揭开了它的面纱,即便如此,仍让我们沉醉不已。
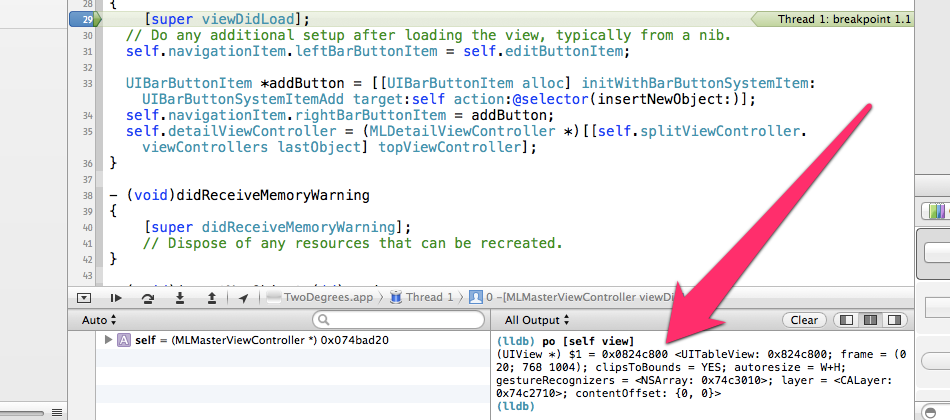
你可能从未使用过LLDB,那让我们先来热热身。 在调试器中最常用到的命令是p(用于输出基本类型)或者po(用于输出 Objective-C 对象)。如下,你可以通过输入po 和 view 来输出 view 的信息:
po [self view]
随后调试器会输出这个 object 的 description。在这个例子中可能是这样的信息:
(UIView *) $1 = 0x0824c800 <UITableView: 0x824c800; frame = (0 20; 768 1004); clipsToBounds = YES; autoresize = W+H; gestureRecognizers = <NSArray: 0x74c3010>; layer = <CALayer: 0x74c2710>; contentOffset: {0, 0}>
什么?在什么地方可以输入这个命令?OK,首先,我们需要先设置一个断点。如下图所示,我在viewDidLoad:中设置了一个了一个断点:
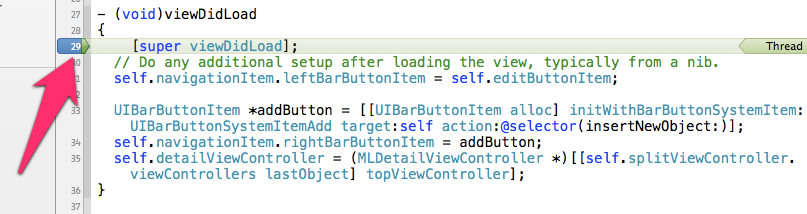
接下来运行程序,然后程序会停留在断点处,从下图你可以看到在什么地方输入LLDB命令:
你可能需要的是 view 下 subview 的数量。由于 subview 的数量是一个 int 类型的值,所以我们使用命令p:
p (int)[[[self view] subviews] count]
最后你看到的输出会是:
(int) $2 = 2
是不是很简单?
细心的朋友可能会发现输出的信息中带有$1、$2的字样。实际上,我们每次查询的结果会保存在一些持续变量中($[0-9]+),这样你可以在后面的查询中直接使用这些值。比如现在我接下来要重新取回$1的值:
(lldb) po $1
(UIView *) $1 = 0x0824c800 <UITableView: 0x824c800; frame = (0 20; 768 1004); clipsToBounds = YES; autoresize = W+H; gestureRecognizers = <NSArray: 0x74c3010>; layer = <CALayer: 0x74c2710>; contentOffset: {0, 0}>
可以看到,我们依然可以取到之前[self view]的值。
LLDB命令还可以用在断点上,详细的使用可以参见这个文章
常用命令
下面补充说明其它一些常用的命令:
- expr
可以在调试时动态执行指定表达式,并将结果打印出来。常用于在调试过程中修改变量的值。
如图设置断点,然后运行程序。程序中断后输入下面的命令:
expr a=2
你会看到如下的输出:
(int) $0 = 2
继续运行程序,程序输出的信息是:
实际值:2
很明显可以看出,变量a的值被改变。 除此之外,还可以使用这个命令新声明一个变量对象,如:
expr int $b=2
p $b
下面的命令用于输出新声明对象的值。(注意,对象名前要加$)
- call
call即是调用的意思。其实上述的po和p也有调用的功能。因此一般只在不需要显示输出,或是方法无返回值时使用call。 和上面的命令一样,我们依然在viewDidLoad:里面设置断点,然后在程序中断的时候输入下面的命令:
call [self.view setBackgroundColor:[UIColor redColor]]
继续运行程序,看看view的背景颜色是不是变成红色的了!在调试的时候灵活运用call命令可以起到事半功倍的作用。
- bt
打印调用堆栈,加all可打印所有thread的堆栈。不详细举例说明,感兴趣的朋友可以自己试试。
- image
image 命令可用于寻址,有多个组合命令。比较实用的用法是用于寻找栈地址对应的代码位置。 下面我写了一段代码
NSArray *arr=[[NSArray alloc] initWithObjects:@"1",@"2", nil];
NSLog(@"%@",arr[2]);
这段代码有明显的错误,程序运行这段代码后会抛出下面的异常:
- *** Terminating app due to uncaught exception 'NSRangeException', reason: '*** -[__NSArrayI objectAtIndex:]: index 2 beyond bounds [0 .. 1]'
- *** First throw call stack:
- (
- 0 CoreFoundation 0x0000000101951495 __exceptionPreprocess + 165
- 1 libobjc.A.dylib 0x00000001016b099e objc_exception_throw + 43
- 2 CoreFoundation 0x0000000101909e3f -[__NSArrayI objectAtIndex:] + 175
- 3 ControlStyleDemo 0x0000000100004af8 -[RootViewController viewDidLoad] + 312
- 4 UIKit 0x000000010035359e -[UIViewController loadViewIfRequired] + 562
- 5 UIKit 0x0000000100353777 -[UIViewController view] + 29
- 6 UIKit 0x000000010029396b -[UIWindow addRootViewControllerViewIfPossible] + 58
- 7 UIKit 0x0000000100293c70 -[UIWindow _setHidden:forced:] + 282
- 8 UIKit 0x000000010029cffa -[UIWindow makeKeyAndVisible] + 51
- 9 ControlStyleDemo 0x00000001000045e0 -[AppDelegate application:didFinishLaunchingWithOptions:] + 672
- 10 UIKit 0x00000001002583d9 -[UIApplication _handleDelegateCallbacksWithOptions:isSuspended:restoreState:] + 264
- 11 UIKit 0x0000000100258be1 -[UIApplication _callInitializationDelegatesForURL:payload:suspended:] + 1605
- 12 UIKit 0x000000010025ca0c -[UIApplication _runWithURL:payload:launchOrientation:statusBarStyle:statusBarHidden:] + 660
- 13 UIKit 0x000000010026dd4c -[UIApplication handleEvent:withNewEvent:] + 3189
- 14 UIKit 0x000000010026e216 -[UIApplication sendEvent:] + 79
- 15 UIKit 0x000000010025e086 _UIApplicationHandleEvent + 578
- 16 GraphicsServices 0x0000000103aca71a _PurpleEventCallback + 762
- 17 GraphicsServices 0x0000000103aca1e1 PurpleEventCallback + 35
- 18 CoreFoundation 0x00000001018d3679 __CFRUNLOOP_IS_CALLING_OUT_TO_A_SOURCE1_PERFORM_FUNCTION__ + 41
- 19 CoreFoundation 0x00000001018d344e __CFRunLoopDoSource1 + 478
- 20 CoreFoundation 0x00000001018fc903 __CFRunLoopRun + 1939
- 21 CoreFoundation 0x00000001018fbd83 CFRunLoopRunSpecific + 467
- 22 UIKit 0x000000010025c2e1 -[UIApplication _run] + 609
- 23 UIKit 0x000000010025de33 UIApplicationMain + 1010
- 24 ControlStyleDemo 0x0000000100006b73 main + 115
- 25 libdyld.dylib 0x0000000101fe95fd start + 1
- 26 ??? 0x0000000000000001 0x0 + 1
- )
- libc++abi.dylib: terminating with uncaught exception of type NSException
现在,我们怀疑出错的地址是0x0000000100004af8(可以根据执行文件名判断,或者最小的栈地址)。为了进一步精确定位,我们可以输入以下的命令:
image lookup --address 0x0000000100004af8
命令执行后返回:
Address: ControlStyleDemo[0x0000000100004af8] (ControlStyleDemo.__TEXT.__text + 13288)
Summary: ControlStyleDemo`-[RootViewController viewDidLoad] + 312 at RootViewController.m:53
我们可以看到,出错的位置是RootViewController.m的第53行。
更多的命令可以参见这个网址。
另外,facebook开源了他们扩展的LLDB命令库,有兴趣的朋友也可以安装看看。
简称和别名
很多时候,LLDB完整的命令是很长的。比如前面所说的image lookup --address这个组合命令。为了方便日常的使用,提高效率,LLDB命令也提供通过简称的方式调用命令。还是这个命令,我们用简称就可以写为im loo -a,是不是简单多了。
如果你是从gdb时代就开始使用调试器的,你会发现,有些命令如p、call等命令和gdb下是一致的。其实这些命令是LLDB一些命令的别名,比如p是frame variable的别名,p view实际上是frame variable view。除了系统自建的LLDB别名,你也可以自定义别名。比如下面这个命令
command alias ioa image lookup --address %1
是将我前面所介绍过的一个命令image lookup --address添加了一个ioa的别名。然后执行下面的命令:
(lldb) ioa 0x0000000100004af8
  Address: ControlStyleDemo[0x0000000100004af8] (ControlStyleDemo.__TEXT.__text + 13288)
  Summary: ControlStyleDemo`-[RootViewController viewDidLoad] + 312 at RootViewController.m:53
可以看到,我们得到了我们想要的结果,而命令却大大缩短。
这里我就不再详细展开,有兴趣的朋友可以查看这个网址。
常见问题
上面我们简单的学习了如何使用LLDB命令。但有时我们在使用这些LLDB命令的时候,依然可能会遇到一些问题。比如下面这个命令。
(lldb) p NSLog(@"%@",[self.view  viewWithTag:1001])
error: 'NSLog' has unknown return type; cast the call to its declared return type
error: 1 errors parsing expression
如果在使用LLDB命令中发现有 unknown type 的类似错误(多见于id类型,比如NSArray中某个值),那我们就必须显式声明类型。比如上面这个命令,我们得这么修改。
p (void)NSLog(@"%@",[self.view viewWithTag:1001])
这样就能得到正确的结果了。
执行类命令集
| LLDB | GDB |
| Launch a process no arguments. | |
| (lldb) process launch (lldb) run (lldb) r |
(gdb) run (gdb) r |
Launch a process with arguments <args>. |
|
| (lldb) process launch — <args> (lldb) r <args> |
(gdb) run <args> (gdb) r <args> |
Launch a process for with arguments a.out 1 2 3 without having to supply the args every time. |
|
| % lldb — a.out 1 2 3 (lldb) run … (lldb) run … |
% gdb –args a.out 1 2 3 (gdb) run … (gdb) run … |
| Launch a process with arguments in new terminal window (Mac OS X only). | |
| (lldb) process launch –tty — <args> (lldb) pro la -t — <args> |
|
| Launch a process with arguments in existing terminal /dev/ttys006 (Mac OS X only). | |
| (lldb) process launch –tty=/dev/ttys006 — <args> (lldb) pro la -t/dev/ttys006 — <args> |
|
| Attach to a process with process ID 123. | |
| (lldb) process attach –pid 123 (lldb) attach -p 123 |
(gdb) attach 123 |
| Attach to a process named “a.out”. | |
| (lldb) process attach –name a.out (lldb) pro at -n a.out |
(gdb) attach a.out |
| Wait for a process named “a.out” to launch and attach. | |
| (lldb) process attach –name a.out –waitfor (lldb) pro at -n a.out -w |
(gdb) attach -waitfor a.out |
| Do a source level single step in the currently selected thread. | |
| (lldb) thread step-in (lldb) step (lldb) s |
(gdb) step (gdb) s |
| Do a source level single step over in the currently selected thread. | |
| (lldb) thread step-over (lldb) next (lldb) n |
(gdb) next (gdb) n |
| Do an instruction level single step in the currently selected thread. | |
| (lldb) thread step-inst (lldb) si |
(gdb) stepi (gdb) si |
| Do an instruction level single step over in the currently selected thread. | |
| (lldb) thread step-inst-over (lldb) ni |
(gdb) nexti (gdb) ni |
| Step out of the currently selected frame. | |
| (lldb) thread step-out (lldb) finish |
(gdb) finish |
| Backtrace and disassemble every time you stop. | |
| (lldb) target stop-hook add Enter your stop hook command(s). Type ‘DONE’ to end. > bt > disassemble –pc > DONE Stop hook #1 added. |
|
断点类命令集
| LLDB | GDB |
| Set a breakpoint at all functions named main. | |
| (lldb) breakpoint set –name main (lldb) br s -n main (lldb) b main |
(gdb) break main |
| Set a breakpoint in file test.c at line 12. | |
| (lldb) breakpoint set –file test.c –line 12 (lldb) br s -f test.c -l 12 (lldb) b test.c:12 |
(gdb) break test.c:12 |
| Set a breakpoint at all C++ methods whose basename is main. | |
| (lldb) breakpoint set –method main (lldb) br s -M main |
(gdb) break main (Hope that there are no C funtions named main). |
| Set a breakpoint at and object C function: -[NSString stringWithFormat:]. | |
| (lldb) breakpoint set –name “-[NSString stringWithFormat:]” (lldb) b -[NSString stringWithFormat:] |
(gdb) break -[NSString stringWithFormat:] |
| Set a breakpoint at all Objective C methods whose selector is count. | |
| (lldb) breakpoint set –selector count (lldb) br s -S count |
(gdb) break count (Hope that there are no C or C++ funtions namedcount). |
| List all breakpoints. | |
| (lldb) breakpoint list (lldb) br l |
(gdb) info break |
| Delete a breakpoint. | |
| (lldb) breakpoint delete 1 (lldb) br del 1 |
(gdb) delete 1 |
监视点(WATCHPOINT)命令集
| LLDB | GDB |
| Set a watchpoint on a variable when it is written to. | |
| (lldb) watchpoint set variable -w write global_var (lldb) watch set var -w write global_var |
(gdb) watch global_var |
| Set a watchpoint on a memory location when it is written into. The size of the region to watch for defaults to the pointer size if no ‘-x byte_size’ is specified. This command takes raw input, evaluated as an expression returning an unsigned integer pointing to the start of the region, after the ‘–’ option terminator. | |
| (lldb) watchpoint set expression -w write — my_ptr (lldb) watch set exp -w write — my_ptr |
(gdb) watch -location g_char_ptr |
| Set a condition on a watchpoint. | |
| (lldb) watch set var -w write global (lldb) watchpoint modify -c ‘(global==5)’ (lldb) c … (lldb) bt * thread #1: tid = 0x1c03, 0x0000000100000ef5 a.out modify + 21 at main.cpp:16, stop reason = watchpoint 1modify + 21 at main.cpp:16frame #1: 0x0000000100000eac a.out main + 108 at main.cpp:25start + 1(lldb) frame var global (int32_t) global = 5 |
|
| List all watchpoints. | |
| (lldb) watchpoint list (lldb) watch l |
(gdb) info break |
| Delete a watchpoint. | |
| (lldb) watchpoint delete 1 (lldb) watch del 1 |
(gdb) delete 1 |
检查变量
| LLDB | GDB |
| Show the arguments and local variables for the current frame. | |
| (lldb) frame variable | (gdb) info args and (gdb) info locals |
| Show the local variables for the current frame. | |
| (lldb) frame variable –no-args (lldb) fr v -a |
(gdb) info locals |
| Show the contents of local variable “bar”. | |
| (lldb) frame variable bar (lldb) fr v bar (lldb) p bar |
(gdb) p bar |
| Show the contents of local variable “bar” formatted as hex. | |
| (lldb) frame variable –format x bar (lldb) fr v -f x bar |
(gdb) p/x bar |
| Show the contents of global variable “baz”. | |
| (lldb) target variable baz (lldb) ta v baz |
(gdb) p baz |
| Show the global/static variables defined in the current source file. | |
| (lldb) target variable (lldb) ta v |
n/a |
| Display a the variable “argc” and “argv” every time you stop. | |
| (lldb) target stop-hook add –one-liner “frame variable argc argv” (lldb) ta st a -o “fr v argc argv” (lldb) display argc (lldb) display argv |
(gdb) display argc (gdb) display argv |
| Display a the variable “argc” and “argv” only when you stop in the function named main. | |
| (lldb) target stop-hook add –name main –one-liner “frame variable argc argv” (lldb) ta st a -n main -o “fr v argc argv” |
|
| Display the variable “*this” only when you stop in c class named MyClass. | |
| (lldb) target stop-hook add –classname MyClass –one-liner “frame variable *this” (lldb) ta st a -c MyClass -o “fr v *this” |
|
检查线程状态
| LLDB | GDB |
| Show the stack backtrace for the current thread. | |
| (lldb) thread backtrace (lldb) bt |
(gdb) bt |
| Show the stack backtraces for all threads. | |
| (lldb) thread backtrace all (lldb) bt all |
(gdb) thread apply all bt |
| Select a different stack frame by index for the current thread. | |
| (lldb) frame select 12 | (gdb) frame 12 |
| List information about the currently selected frame in the current thread. | |
| (lldb) frame info | |
| Select the stack frame that called the current stack frame. | |
| (lldb) up (lldb) frame select –relative=1 |
(gdb) up |
| Select the stack frame that is called by the current stack frame. | |
| (lldb) down (lldb) frame select –relative=-1 (lldb) fr s -r-1 |
(gdb) down |
| Select a different stack frame using a relative offset. | |
| (lldb) frame select –relative 2 (lldb) fr s -r2 (lldb) frame select –relative -3 |
(gdb) up 2 (gdb) down 3 |
| Show the general purpose registers for the current thread. | |
| (lldb) register read | (gdb) info registers |
| Show the general purpose registers for the current thread formatted as signed decimal. LLDB tries to use the same format characters as printf(3) when possible. Type “help format” to see the full list of format specifiers. | |
| (lldb) register read –format i (lldb) re r -f i LLDB now supports the GDB shorthand format syntax but there can’t be space after the command: |
|
| Show all registers in all register sets for the current thread. | |
| (lldb) register read –all (lldb) re r -a |
(gdb) info all-registers |
| Show the values for the registers named “rax”, “rsp” and “rbp” in the current thread. | |
| (lldb) register read rax rsp rbp | (gdb) info all-registers rax rsp rbp |
| Show the values for the register named “rax” in the current thread formatted as binary. | |
| (lldb) register read –format binary rax (lldb) re r -f b rax LLDB now supports the GDB shorthand format syntax but there can’t be space after the command: |
(gdb) p/t $rax |
| Read memory from address 0xbffff3c0 and show 4 hex uint32_t values. | |
| (lldb) memory read –size 4 –format x –count 4 0xbffff3c0 (lldb) me r -s4 -fx -c4 0xbffff3c0 (lldb) x -s4 -fx -c4 0xbffff3c0 LLDB now supports the GDB shorthand format syntax but there can’t be space after the command: |
(gdb) x/4xw 0xbffff3c0 |
| Read memory starting at the expression “argv[0]“. | |
(lldb) memory read argv[0]NOTE: any command can inline a scalar expression result (as long as the target is stopped) using backticks around any expression: (lldb) memory read –size sizeof(int) argv[0] |
(gdb) x argv[0] |
| Read 512 bytes of memory from address 0xbffff3c0 and save results to a local file as text. | |
| (lldb) memory read –outfile /tmp/mem.txt –count 512 0xbffff3c0 (lldb) me r -o/tmp/mem.txt -c512 0xbffff3c0 (lldb) x/512bx -o/tmp/mem.txt 0xbffff3c0 |
(gdb) set logging on (gdb) set logging file /tmp/mem.txt (gdb) x/512bx 0xbffff3c0 (gdb) set logging off |
| Save binary memory data starting at 0×1000 and ending at 0×2000 to a file. | |
| (lldb) memory read –outfile /tmp/mem.bin –binary 0×1000 0×1200 (lldb) me r -o /tmp/mem.bin -b 0×1000 0×1200 |
|
| (gdb) dump memory /tmp/mem.bin 0×1000 0×2000 | |
| Disassemble the current function for the current frame. | |
| (lldb) disassemble –frame (lldb) di -f |
(gdb) disassemble |
| Disassemble any functions named main. | |
| (lldb) disassemble –name main (lldb) di -n main |
(gdb) disassemble main |
| Disassemble an address range. | |
| (lldb) disassemble –start-address 0x1eb8 –end-address 0x1ec3 (lldb) di -s 0x1eb8 -e 0x1ec3 |
(gdb) disassemble 0x1eb8 0x1ec3 |
| Disassemble 20 instructions from a given address. | |
| (lldb) disassemble –start-address 0x1eb8 –count 20 (lldb) di -s 0x1eb8 -c 20 |
(gdb) x/20i 0x1eb8 |
| Show mixed source and disassembly for the current function for the current frame. | |
| (lldb) disassemble –frame –mixed (lldb) di -f -m |
n/a |
| Disassemble the current function for the current frame and show the opcode bytes. | |
| (lldb) disassemble –frame –bytes (lldb) di -f -b |
n/a |
| Disassemble the current source line for the current frame. | |
| (lldb) disassemble –line (lldb) di -l |
n/a |
可执行文件和共享库查询命令
| LLDB | GDB |
| List the main executable and all dependent shared libraries. | |
| (lldb) image list | (gdb) info shared |
| Lookup information for a raw address in the executable or any shared libraries. | |
| (lldb) image lookup –address 0x1ec4 (lldb) im loo -a 0x1ec4 |
(gdb) info symbol 0x1ec4 |
| Lookup information for an address in a.out only. | |
| (lldb) image lookup –address 0x1ec4 a.out (lldb) im loo -a 0x1ec4 a.out |
|
Lookup information for for a type Point by name. |
|
| (lldb) image lookup –type Point (lldb) im loo -t Point |
(lldb) ptype Point |
| Dump all sections from the main executable and any shared libraries. | |
| (lldb) image dump sections | (gdb) maintenance info sections |
| Dump all sections in the a.out module. | |
| (lldb) image dump sections a.out | |
| Dump all symbols from the main executable and any shared libraries. | |
| (lldb) image dump symtab | |
| Dump all symbols in a.out and liba.so. | |
| (lldb) image dump symtab a.out liba.so | |
杂项
| LLDB | GDB |
| Echo text to the screen. | |
| (lldb) script print “Here is some text” | (gdb) echo Here is some text
|