代码如下:
floorSalesBar(){//方法名====这个方法应该放在methods中并在mounted中调用哦
methods
let _this = this;
let myChart = _this.$echarts.init(document.getElementById('floorSales'));
let option = {
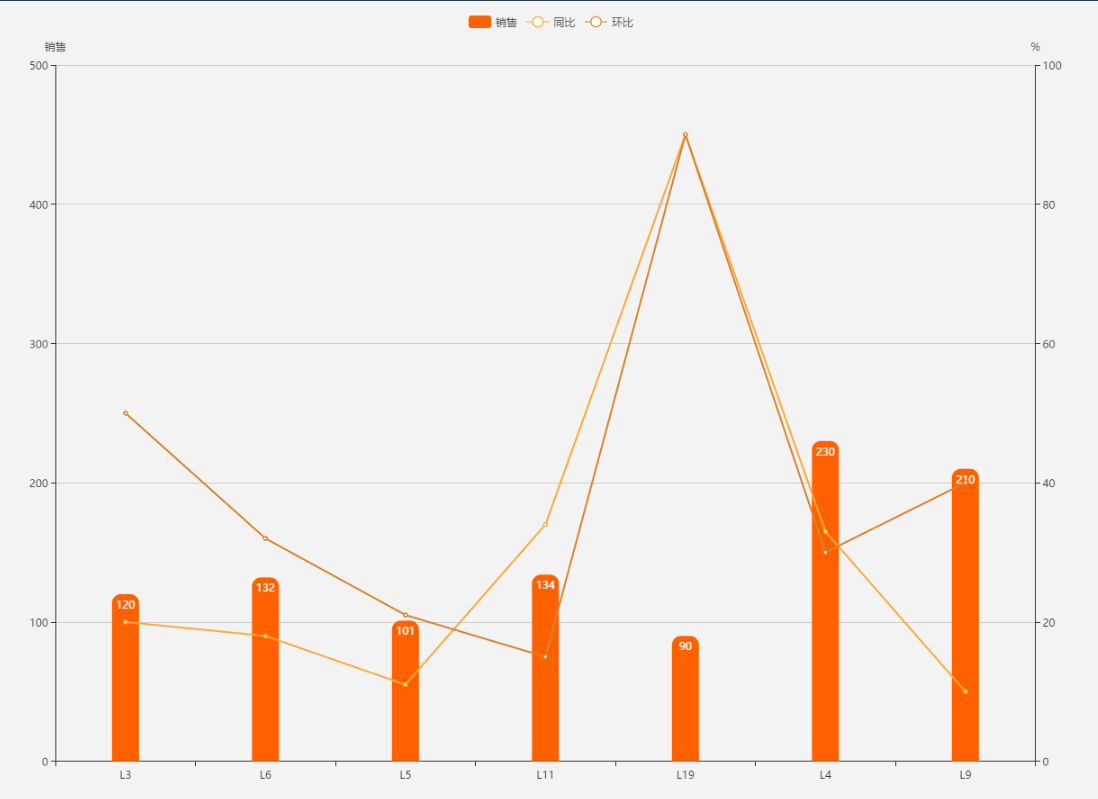
color:['#ff6100','#ffa836','#d9822a'],
legend: {
data: ['销售', '同比', '环比']
},
grid: {
left: '3%',
right: '4%',
bottom: '3%',
containLabel: true
},
xAxis: {
type: 'category',
boundaryGap: true,
data: ['L3', 'L6', 'L5', 'L11', 'L19', 'L4', 'L9']
},
yAxis: [//这里两个坐标轴,因为下面用的数据有柱状图和折线图,而他们的一个是数值,一个是百分比因此数的范围不一样,因此这里要加入id来定义坐标轴的标记下面 yAxisIndex相对应其标记号就可以取这个坐标轴线了
{
name: '销售',
type: 'value',
id:0,
max: 500
},
{
name: '%',
nameLocation: 'end',
max: 100,
id:1,
type: 'value',
}
],
series: [
{
name: '销售',
type: 'bar',
barMaxWidth:25,//柱状图的宽度
yAxisIndex:0,//对应y轴的那一组坐标
label:{
show:true,
position:'insideTop'//柱状图上文字的位置
},
itemStyle:{
barBorderRadius: [7, 7, 0, 0]//柱状图的边框
},
data: [120, 132, 101, 134, 90, 230, 210]
},
{
name: '同比',
type: 'line',
yAxisIndex:1,
data: [20, 18, 11, 34, 90, 33, 10]
},
{
name: '环比',
type: 'line',
yAxisIndex:1,
data: [50, 32, 21, 15, 90, 30, 40]
}
]
};
window.onresize = function () {
myChart.resize();
};
// 为echarts对象加载数据
myChart.setOption(option);
}
}
}