最近在研究热力图,发现了一篇可能有用的Python模拟疫情扩散的文章,可以部分模拟热力图,整篇文章原文内容如下:
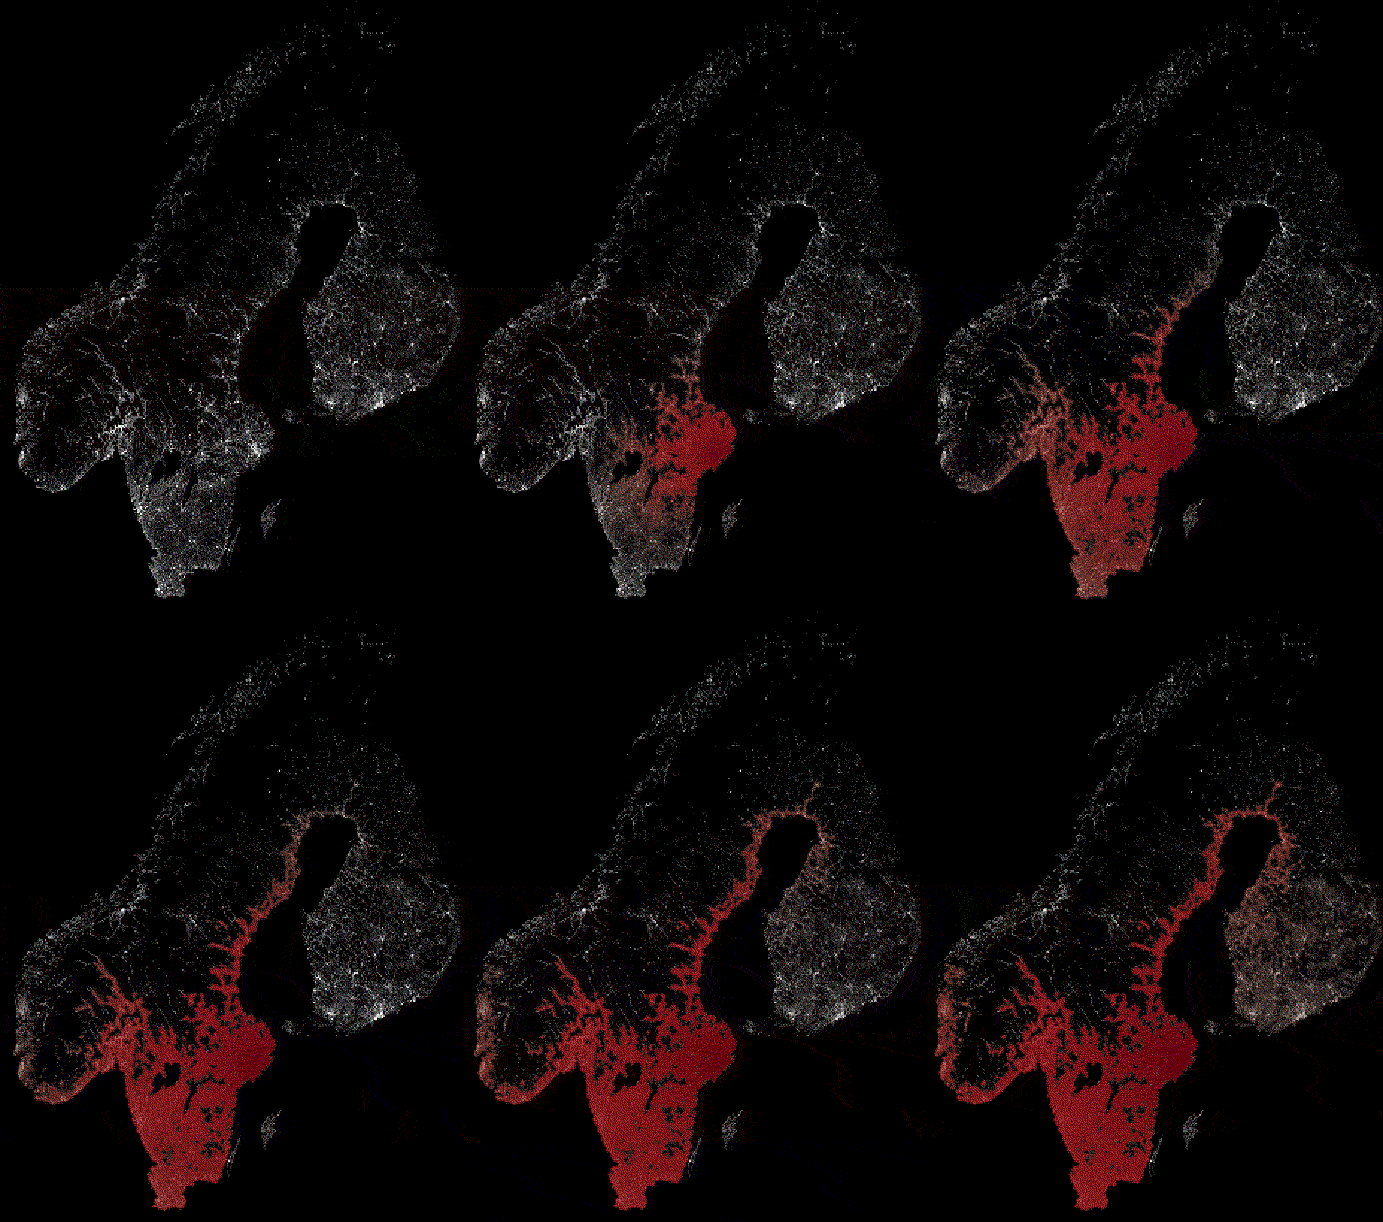
瘟疫蔓延,连芬兰都难以幸免
受杰森的《Almost Looks Like Work》启发,我来展示一些病毒传播模型。需要注意的是这个模型并不反映现实情况,因此不要误以为是西非可怕的传染病。相反,它更应该被看做是某种虚构的僵尸爆发现象。那么,让我们进入主题。

这就是SIR模型,其中字母S、I和R反映的是在僵尸疫情中,个体可能处于的不同状态。
- S 代表易感群体,即健康个体中潜在的可能转变的数量。
- I 代表染病群体,即僵尸数量。
- R 代表移除量,即因死亡而退出游戏的僵尸数量,或者感染后又转回人类的数量。但对与僵尸不存在治愈者,所以我们就不要自我愚弄了(如果要把SIR模型应用到流感传染中,还是有治愈者的)。
至于β(beta)和γ(gamma):
- β(beta)表示疾病的传染性程度,只要被咬就会感染。
- γ(gamma)表示从僵尸走向死亡的速率,取决于僵尸猎人的平均工作速率,当然,这不是一个完美的模型,请对我保持耐心。
S′=−βIS告诉我们健康者变成僵尸的速率,S′是对时间的导数。
I′=βIS−γI告诉我们感染者是如何增加的,以及行尸进入移除态速率(双关语)。
R′=γI只是加上(gamma I),这一项在前面的等式中是负的。
上面的模型没有考虑S/I/R的空间分布,下面来修正一下!
一种方法是把瑞典和北欧国家分割成网格,每个单元可以感染邻近单元,描述如下:

其中对于单元![]() ,
,![]() 和
和![]() 是它周围的四个单元。(不要因为对角单元而脑疲劳,我们需要我们的大脑不被吃掉)。
是它周围的四个单元。(不要因为对角单元而脑疲劳,我们需要我们的大脑不被吃掉)。
初始化一些需要的库以及数据
 1 import numpy as np
 2 import math
 3 import matplotlib.pyplot as plt
 4
 5 from matplotlib import rcParams
 6 import matplotlib.image as mpimg
 7 rcParams['font.family'] = 'serif'
 8 rcParams['font.size'] = 16
 9 rcParams['figure.figsize'] = 12, 8
10 from PIL import Image
适当的beta和gamma值就能够摧毁大半江山
1 beta = 0.010
2 gamma = 1
还记得导数的定义么?当导数已知,假设Δt很小的情况下,经过重新整理,它可以用来近似预测函数的下一个取值,我们已经声明过u′(t)。
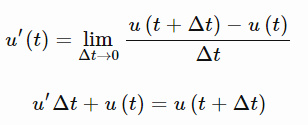
回想前面:
![]()
我们把函数(u(t +△t))在下一个时间步记为![]() ,
,![]() 表示当前时间步。
表示当前时间步。
![]()
这种方法叫做欧拉法,代码如下:
1 def euler_step(u, f, dt):
2     return u + dt * f(u)
我们需要函数f(u)。友好的numpy提供了简洁的数组操作。我可能会在另一篇文章中回顾它,因为它们太强大了,需要更多的解释,但现在这样就能达到效果:
 1 def f(u):
 2     S = u[0]
 3     I = u[1]
 4     R = u[2]
 5
 6     new = np.array([-beta*(S[1:-1, 1:-1]*I[1:-1, 1:-1] +
 7                             S[0:-2, 1:-1]*I[0:-2, 1:-1] +
 8                             S[2:, 1:-1]*I[2:, 1:-1] +
 9                             S[1:-1, 0:-2]*I[1:-1, 0:-2] +
10                             S[1:-1, 2:]*I[1:-1, 2:]),
11                      beta*(S[1:-1, 1:-1]*I[1:-1, 1:-1] +
12                             S[0:-2, 1:-1]*I[0:-2, 1:-1] +
13                             S[2:, 1:-1]*I[2:, 1:-1] +
14                             S[1:-1, 0:-2]*I[1:-1, 0:-2] +
15                             S[1:-1, 2:]*I[1:-1, 2:]) - gamma*I[1:-1, 1:-1],
16                      gamma*I[1:-1, 1:-1]
17                     ])
18
19     padding = np.zeros_like(u)
20     padding[:,1:-1,1:-1] = new
21     padding[0][padding[0] < 0] = 0
22     padding[0][padding[0] > 255] = 255
23     padding[1][padding[1] < 0] = 0
24     padding[1][padding[1] > 255] = 255
25     padding[2][padding[2] < 0] = 0
26     padding[2][padding[2] > 255] = 255
27
28     return padding
导入北欧国家的人口密度图并进行下采样,以便较快地得到结果
1 from PIL import Image
2 img = Image.open('popdens2.png')
3 img = img.resize((img.size[0]/2,img.size[1]/2))
4 img = 255 - np.asarray(img)
5 imgplot = plt.imshow(img)
6 imgplot.set_interpolation('nearest')
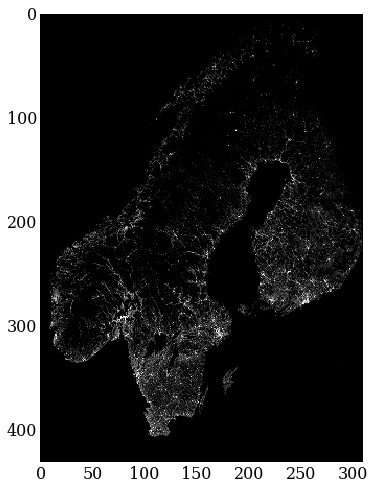
北欧国家的人口密度图(未包含丹麦)
S矩阵,也就是易感个体,应该近似于人口密度。感染者初始值是0,我们把斯德哥尔摩作为第一感染源。
1 S_0 = img[:,:,1]
2 I_0 = np.zeros_like(S_0)
3 I_0[309,170] = 1 # patient zero
因为还没人死亡,所以把矩阵也置为0.
1 R_0 = np.zeros_like(S_0)
接着初始化模拟时长等。
 1 T = 900                         # final time
 2 dt = 1                          # time increment
 3 N = int(T/dt) + 1               # number of time-steps
 4 t = np.linspace(0.0, T, N)      # time discretization
 5
 6 # initialize the array containing the solution for each time-step
 7 u = np.empty((N, 3, S_0.shape[0], S_0.shape[1]))
 8 u[0][0] = S_0
 9 u[0][1] = I_0
10 u[0][2] = R_0
我们需要自定义一个颜色表,这样才能将感染矩阵显示在地图上。
1 import matplotlib.cm as cm
2 theCM = cm.get_cmap("Reds")
3 theCM._init()
4 alphas = np.abs(np.linspace(0, 1, theCM.N))
5 theCM._lut[:-3,-1] = alphas
下面坐下来欣赏吧…
1 for n in range(N-1):
2     u[n+1] = euler_step(u[n], f, dt)
让我们再做一下图像渲染,把它做成gif,每个人都喜欢gifs!
 1 from images2gif import writeGif
 2
 3 keyFrames = []
 4 frames = 60.0
 5
 6 for i in range(0, N-1, int(N/frames)):
 7     imgplot = plt.imshow(img, vmin=0, vmax=255)
 8     imgplot.set_interpolation("nearest")
 9     imgplot = plt.imshow(u[i][1], vmin=0, cmap=theCM)
10     imgplot.set_interpolation("nearest")
11     filename = "outbreak" + str(i) + ".png"
12     plt.savefig(filename)
13     keyFrames.append(filename)
14
15 images = [Image.open(fn) for fn in keyFrames]
16 gifFilename = "outbreak.gif"
17 writeGif(gifFilename, images, duration=0.3)
18 plt.clf()
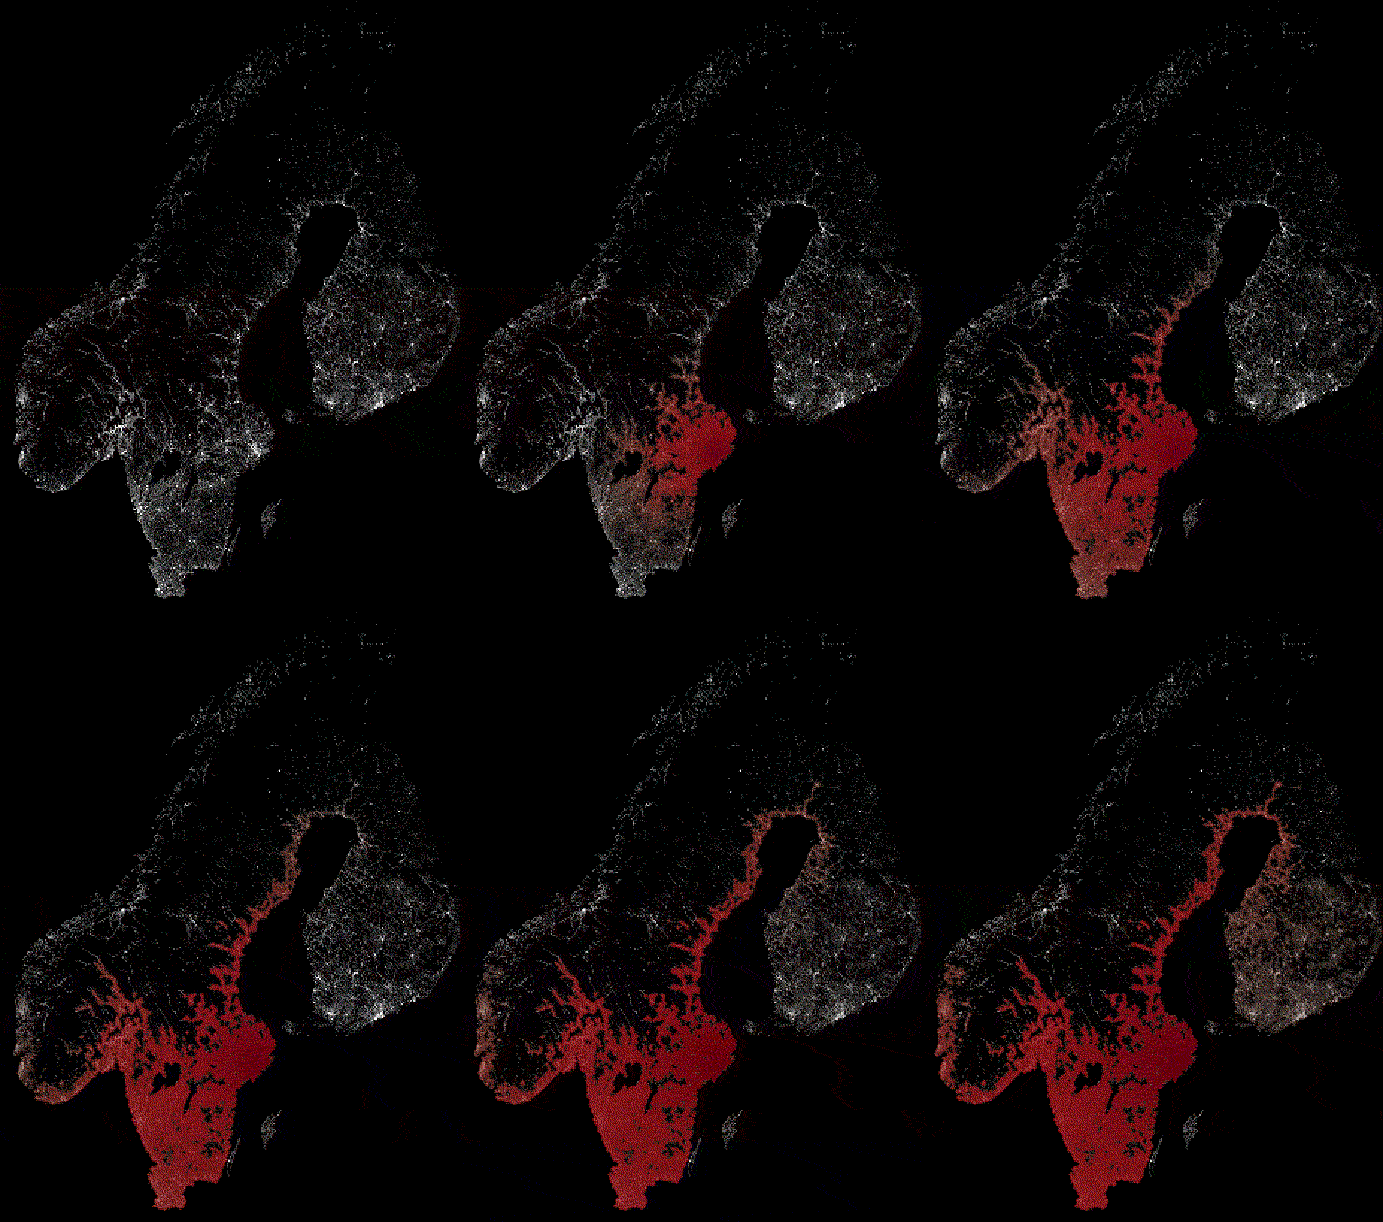
瘟疫蔓延的gif图,连芬兰都难以幸免
看,唯一安全的地方是人口密度不太高的北部地区,动画中连芬兰最后都被感染了,现在你明白了吧。
如果你想了解更多微分方程的求解,温馨向您推荐LorenaABarba 的实用数值方法的Python实现课程,你可以从中学习所有实数的数值求解方法,而不是本文中简单的这种。
更新:你可以在这里找到Ipython版本的笔记。
实际运行上面的例子的代码是存在问题的,往往会编译不通过,下面是经过调整后的代码例子,可以正常运行:
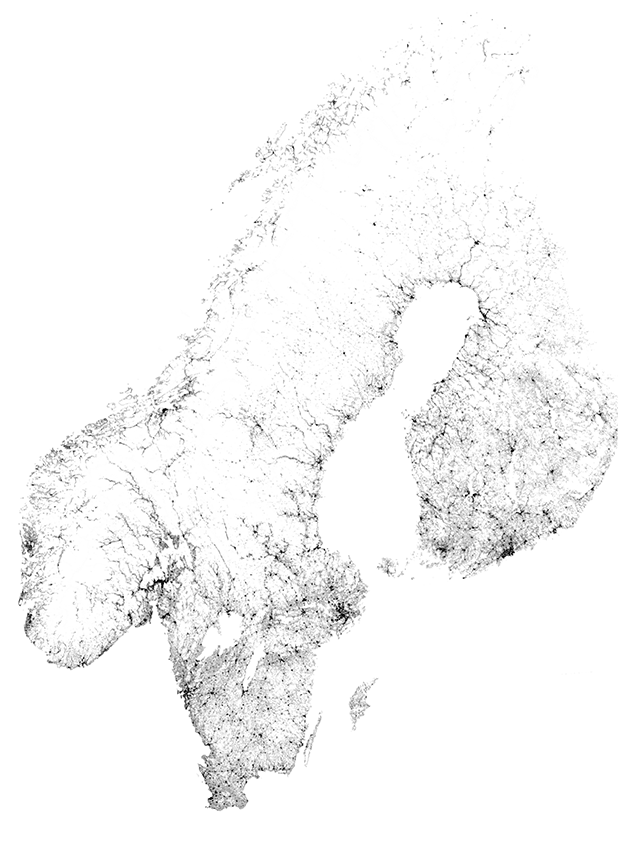
上图是代码需要的图片popdens2.png
具体的代码:
import numpy as np
import math
import matplotlib.pyplot as plt

from matplotlib import rcParams
import matplotlib.image as mpimg
rcParams['font.family'] = 'serif'
rcParams['font.size'] = 16
rcParams['figure.figsize'] = 12, 8
from PIL import Image

beta = 0.010
gamma = 1

def euler_step(u, f, dt):
    return u + dt * f(u)

def f(u):
    S = u[0]
    I = u[1]
    R = u[2]

    new = np.array([-beta*(S[1:-1, 1:-1]*I[1:-1, 1:-1] +
                            S[0:-2, 1:-1]*I[0:-2, 1:-1] +
                            S[2:, 1:-1]*I[2:, 1:-1] +
                            S[1:-1, 0:-2]*I[1:-1, 0:-2] +
                            S[1:-1, 2:]*I[1:-1, 2:]),
                     beta*(S[1:-1, 1:-1]*I[1:-1, 1:-1] +
                            S[0:-2, 1:-1]*I[0:-2, 1:-1] +
                            S[2:, 1:-1]*I[2:, 1:-1] +
                            S[1:-1, 0:-2]*I[1:-1, 0:-2] +
                            S[1:-1, 2:]*I[1:-1, 2:]) - gamma*I[1:-1, 1:-1],
                     gamma*I[1:-1, 1:-1]
                    ])

    padding = np.zeros_like(u)
    padding[:,1:-1,1:-1] = new
    padding[0][padding[0] < 0] = 0
    padding[0][padding[0] > 255] = 255
    padding[1][padding[1] < 0] = 0
    padding[1][padding[1] > 255] = 255
    padding[2][padding[2] < 0] = 0
    padding[2][padding[2] > 255] = 255

    return padding


from PIL import Image
img = Image.open('popdens2.png')
img = img.resize((img.size[0]/2,img.size[1]/2))
img = 255 - np.asarray(img)
imgplot = plt.imshow(img)
imgplot.set_interpolation('nearest')

S_0 = img[:,:,1]
I_0 = np.zeros_like(S_0)
I_0[309,170] = 1 # patient zero

R_0 = np.zeros_like(S_0)


T = 900                         # final time
dt = 1                          # time increment
N = int(T/dt) + 1               # number of time-steps
t = np.linspace(0.0, T, N)      # time discretization

# initialize the array containing the solution for each time-step
u = np.empty((N, 3, S_0.shape[0], S_0.shape[1]))
u[0][0] = S_0
u[0][1] = I_0
u[0][2] = R_0

import matplotlib.cm as cm
theCM = cm.get_cmap("Reds")
theCM._init()
alphas = np.abs(np.linspace(0, 1, theCM.N))
theCM._lut[:-3,-1] = alphas

for n in range(N-1):
    u[n+1] = euler_step(u[n], f, dt)

keyFrames = []
frames = 60.0

for i in range(0, N-1, int(N/frames)):
    imgplot = plt.imshow(img, vmin=0, vmax=255)
    imgplot.set_interpolation("nearest")
    imgplot = plt.imshow(u[i][1], vmin=0, cmap=theCM)
    imgplot.set_interpolation("nearest")
    filename = "outbreak" + str(i) + ".png"
    plt.savefig(filename)
    keyFrames.append(filename)

import imageio

def create_gif(image_list, gif_name,gif_duration=0.1):

    frames = []
    for image_name in image_list:
        frames.append(imageio.imread(image_name))
    # Save them as frames into a gif
    imageio.mimsave(gif_name, frames, 'GIF', duration = gif_duration)


image_list=keyFrames
gif_name = 'zombie.gif'
create_gif(image_list, gif_name,gif_duration=0.3)
plt.clf()