OpenFlashChart简介
2009-1-10 8:29:00OpenFlashChart是一款开源的以Flash和Javascript为技术基础的免费图表,用它能创建一些很有效果的报表分析图表。
最重要的是它是开源和免费的,由于平时我使用的是.NET的开发技术,所以就以.NET技术为研究对象,当然它可以支持多种语言。

如何工作?
- 使用浏览器浏览网页
- 浏览器下载带有OpenFlashChart的网页
- 显示图表.
- 只要告诉data文件给OpenFlashChart即可。其余的事由OpenFlashChart引擎来做吧。
饼图:

3D 柱状图等等。

Live Demo
Y
Axis0100200300400500240211
X
Axis09/20
200708/21
200807/23
200906/24
201005/26
201106/24
201009/16
201004/01
201006/24
201009/16
201012/09
201003/03
2011
200708/21
200807/23
200906/24
201005/26
201106/24
201009/16
201004/01
201006/24
201009/16
201012/09
201003/03
2011
Series 1
Series 2
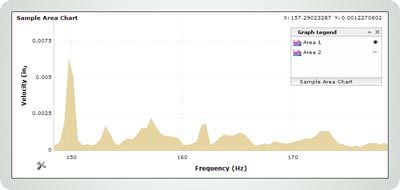
Emprise JavaScript
Charts
Features
- Interactive: Features such as Hints, Mouse Tracking, Mouse Events, Key Tracking and Events, Zooming, Scrolling, and Crosshairs raise interactivity and user experience in web charting to a new level.
 Axis Scaling: There's no need to determine your
data range before hand. EJSChart will calculate and scale automatically to fit
whatever data it is presented with.
- Auto Zooming, Scrolling: Too much data and not enough screen real estate? Show it all. Let your end users zoom in on the pieces they're most interested in. Axis locking for single axis zoom, scrolling and automatic axis scaling are all included.
 Stackable Series: Multiple chart series can be
stacked and combined to fit many charting needs.
- Multiple Chart Types: Line, Area, Scatter, Pie, Bar and Function series are just the beginning. New series are just a few lines of JavaScript code away.
- Ajax-Driven Data: EJSChart supports XML-formatted data and loads data on the fly. New series can be added and data updated in real time without page reloads.
- Compatible: Built with compatibility in mind and
tested on all major browsers, you can be assured your charts will function
consistently for the broadest range of end users.
See the full list of compatible browsers. - Plugin Free: 100% Pure JavaScript Charting Solution. No more worries of incompatible plugin versions or confusing security warnings. EJSChart is pure JavaScript and requires no client installation.
- Customizable: Every aspect of the charting display can be configured and customized through well-documented properties and methods. Want to do more than just change the color of the background? Need a series type which doesn't already exist? EJSChart is fully customizable and extendable to provide the greatest flexibility and integration for existing site designs and needs.
分布式系统中的幂等性
Exception引起的性能问题
TFS2017新特性(一)
云平台架构变迁
MQ基本概念
SVN版本管理
1年内4次架构调整,谈Nice的服务端架构变迁之路
鏖战双十一-阿里直播平台面临的技术挑战
统一日志平台初探
