这篇博客讲的是elasticsearch+logstash+kibana部署的方法。
内容大纲:
1、elasticsearch+logstash+kibana部署
2、收集Tomcat日志
3、收集tcp日志
一、elasticsearch+logstash+kibana部署
1、elasticsearch部署
由于条件有限,这三个组件都装在同一台机器上面。
系统版本:
elasticsearch-6.7.0、logstash-6.7.0、kibana-6.7.0-linux-x86_64
[root@openstack ~]# cd /usr/local/elasticsearch-6.7.0/
[root@openstack elasticsearch-6.7.0]# ls
bin config lib LICENSE.txt logs modules NOTICE.txt plugins README.textile
[root@openstack elasticsearch-6.7.0]# vim config/elasticsearch.yml
[root@openstack elasticsearch-6.7.0]# grep '^[a-z]' config/elasticsearch.yml
cluster.name: my-application
node.name: node-1
path.data: /elk/data
path.logs: /elk/logs
bootstrap.memory_lock: true
network.host: 0.0.0.0
http.port: 9200
http.cors.enabled: true
http.cors.allow-origin: "*"
[root@openstack ~]# mkdir -p /elk/data/ /elk/logs/
[root@openstack ~]# useradd elasticsearch
[root@openstack ~]# chown -R elasticsearch:elasticsearch /elk/
[root@openstack ~]# chown -R elasticsearch:elasticsearch /usr/local/elasticsearch-6.0.0
[root@openstack ~]# su - elasticsearch
[elasticsearch@openstack ~]$ cd /usr/local/elasticsearch-6.0.0/
[elasticsearch@openstack bin]$ ./elasticsearch -d 后台启动,此时启动不了,需要修改一下配置
[root@openstack ~]# vim /etc/security/limits.conf 重启参数才能生效
* hard nofile 65536
* soft nofile 65536
* soft memlock unlimited
* hard memlock unlimited
[root@openstack ~]# vim /etc/sysctl.conf
vm.max_map_count=262144
[root@openstack ~]# sysctl -p 参数生效
切换用户之后重新启动,查看进程和监听端口
[root@openstack ~]# ps -ef|grep java 查看进程
elastic+
6750 1 1 12:29 pts/2 00:02:30 /bin/java -Xms1g -Xmx1g
-XX:+UseConcMarkSweepGC -XX:CMSInitiatingOccupancyFraction=75
-XX:+UseCMSInitiatingOccupancyOnly -XX:+AlwaysPreTouch -server -Xss1m
-Djava.awt.headless=true -Dfile.encoding=UTF-8 -Djna.nosys=true
-XX:-OmitStackTraceInFastThrow -Dio.netty.noUnsafe=true
-Dio.netty.noKeySetOptimization=true
-Dio.netty.recycler.maxCapacityPerThread=0
-Dlog4j.shutdownHookEnabled=false -Dlog4j2.disable.jmx=true
-XX:+HeapDumpOnOutOfMemoryError
-Des.path.home=/usr/local/elasticsearch-6.0.0
-Des.path.conf=/usr/local/elasticsearch-6.0.0/config -cp
/usr/local/elasticsearch-6.0.0/lib/*
org.elasticsearch.bootstrap.Elasticsearch -d
[root@openstack ~]# netstat -tlunp|grep java 查看端口
tcp6 0 0 :::9200 :::* LISTEN 6750/java
tcp6 0 0 :::9300 :::* LISTEN 6750/java
[root@openstack ~]# curl 192.168.209.7:9200 查看信息
{
"name" : "node-1",
"cluster_name" : "my-application",
"cluster_uuid" : "Z3TOUu0jTUiCSHsuFJsv_g",
"version" : {
"number" : "6.0.0",
"build_hash" : "8f0685b",
"build_date" : "2017-11-10T18:41:22.859Z",
"build_snapshot" : false,
"lucene_version" : "7.0.1",
"minimum_wire_compatibility_version" : "5.6.0",
"minimum_index_compatibility_version" : "5.0.0"
},
"tagline" : "You Know, for Search"
}
2、kibana部署:
[root@openstack ~]# cd /usr/local/src/kibana-6.7.0-linux-x86_64/
[root@openstack kibana-6.7.0-linux-x86_64]# grep '^[a-z]' config/kibana.yml
server.port: 5601
server.host: "192.168.199.7"
elasticsearch.url: "http://192.168.199.7:9200"
kibana.index: ".kibana"
[root@openstack ~]# useradd kibana
[root@openstack ~]# chown -R kibana:kibana /usr/local/src/kibana-6.7.0-linux-x86_64
[root@openstack ~]# su - kibana
[kibana@openstack ~]$ cd /usr/local/src/kibana-6.7.0-linux-x86_64/bin/
[kibana@openstack bin]$ nohup ./kibana &
[root@openstack ~]# ps -ef|grep kibana
kibana 3704 1 2 12:20 pts/1 00:08:52 ./../node/bin/node --no-warnings --max-http-header-size=65536 ./../src/cli
[root@openstack ~]# netstat -tlunp|grep 5601
tcp 0 0 192.168.199.7:5601 0.0.0.0:* LISTEN 3704/./../node/bin/
在页面访问:

kibana部署完成。
3、logstash部署
[root@openstack ~]# cd /usr/local/src/logstash-6.7.0/
自己写一下配置文件
[root@openstack logstash-6.7.0]# cat config/tomcat.conf
input {
file {
path => ["/app/tomcat/logs/*"]
type => "tomcat-access-log-5612"
start_position => "beginning"
stat_interval => "2"
codec => "json"
}
}
output {
elasticsearch {
hosts => ["192.168.199.7:9200"]
index => "logstash-tomcat-access-log-5612-%{+YYYY.MM.dd}"
}
file {
path => "/tmp/tomcat.txt"
}
}
[root@openstack logstash-6.7.0]# ./bin/logstash -f config/tomcat.conf -t 测试一下配置文件是否正确
Sending Logstash logs to /usr/local/src/logstash-6.7.0/logs which is now configured via log4j2.properties
[2019-04-05T19:04:13,134][WARN ][logstash.config.source.multilocal] Ignoring the 'pipelines.yml' file because modules or command line options are specified
Configuration OK
[2019-04-05T19:04:37,134][INFO ][logstash.runner ] Using config.test_and_exit mode. Config Validation Result: OK. Exiting Logstash
有这个字段(Configuration OK)表示没有问题,去掉-t之后就可以启动了。
logstash部署完成。
二、收集Tomcat日志。
简单安装一下Tomcat
[root@openstack ~]# cd /app/apache-tomcat-8.5.35/
[root@openstack ~]# cd /app/
[root@openstack app]# ln -sv /app/apache-tomcat-8.5.35 /app/tomcat
[root@openstack app]# ll
总用量 0
drwxr-xr-x. 9 root root 220 4月 5 12:40 apache-tomcat-8.5.35
lrwxrwxrwx. 1 root root 25 4月 5 12:41 tomcat -> /app/apache-tomcat-8.5.35
[root@openstack app]# cd tomcat/webapps/
[root@openstack webapps]# rm -rf *
[root@openstack webapps]# mkdir test
[root@openstack test]# cat index.html
tomcat page
[root@openstack bin]# cd /app/tomcat/bin/
[root@openstack bin]# ./startup.sh
[root@openstack bin]# netstat -tlunp|grep 8080
tcp6 0 0 :::8080 :::* LISTEN 10106/java
页面访问:
启动一下logstash让日志传过来,然后在页面查看:
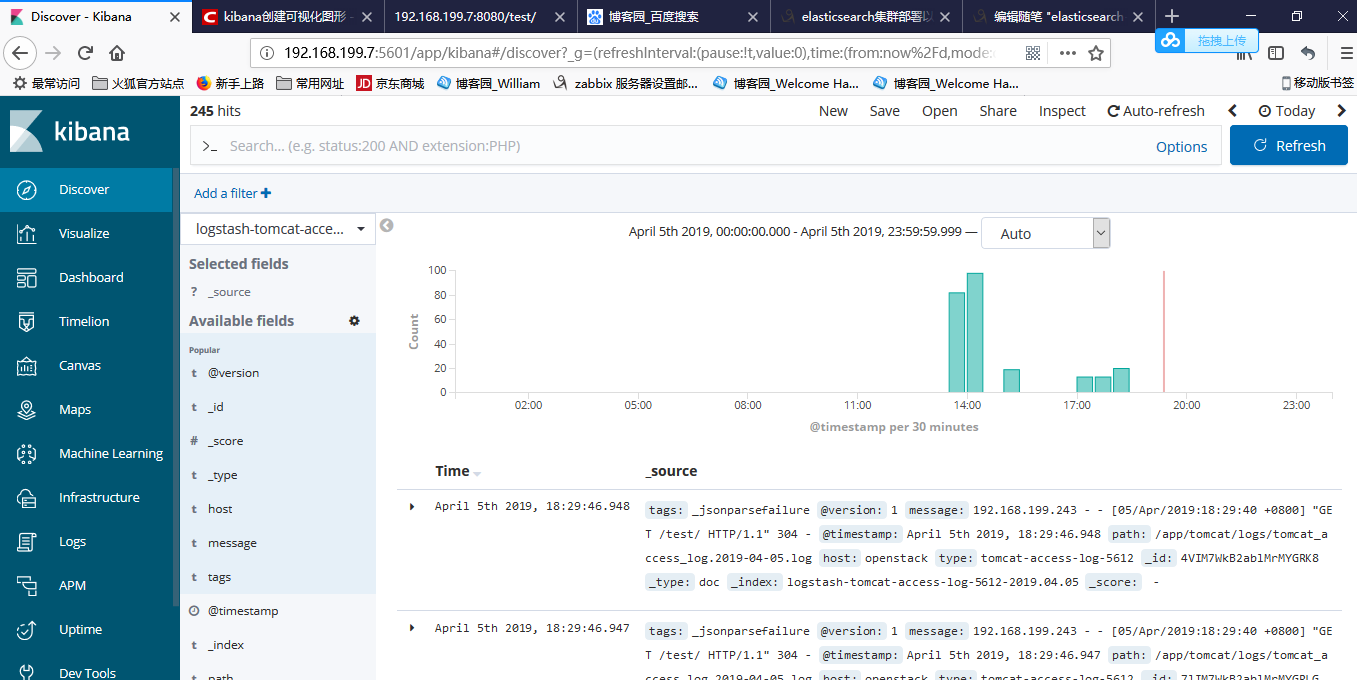
此时就有了日志。
三、收集tcp日志
1、测试
[root@openstack ~]# cd /usr/local/src/logstash-6.7.0/
[root@openstack logstash-6.7.0]# cat config/tcp.conf
input {
tcp {
port => "8443"
type => "tcplog"
}
}
output {
stdout {
codec => "rubydebug"
}
}
[root@openstack logstash-6.7.0]# ./bin/logstash -f config/tcp.conf.bak -t
Sending Logstash logs to /usr/local/src/logstash-6.7.0/logs which is now configured via log4j2.properties
[2019-04-05T19:30:58,968][WARN ][logstash.config.source.multilocal] Ignoring the 'pipelines.yml' file because modules or command line options are specified
Configuration OK
[2019-04-05T19:31:09,882][INFO ][logstash.runner ] Using config.test_and_exit mode. Config Validation Result: OK. Exiting Logstash
[root@openstack ~]# yum -y install nc
查看一下,logstash的配置文件名称可以随便命名,只要指定就行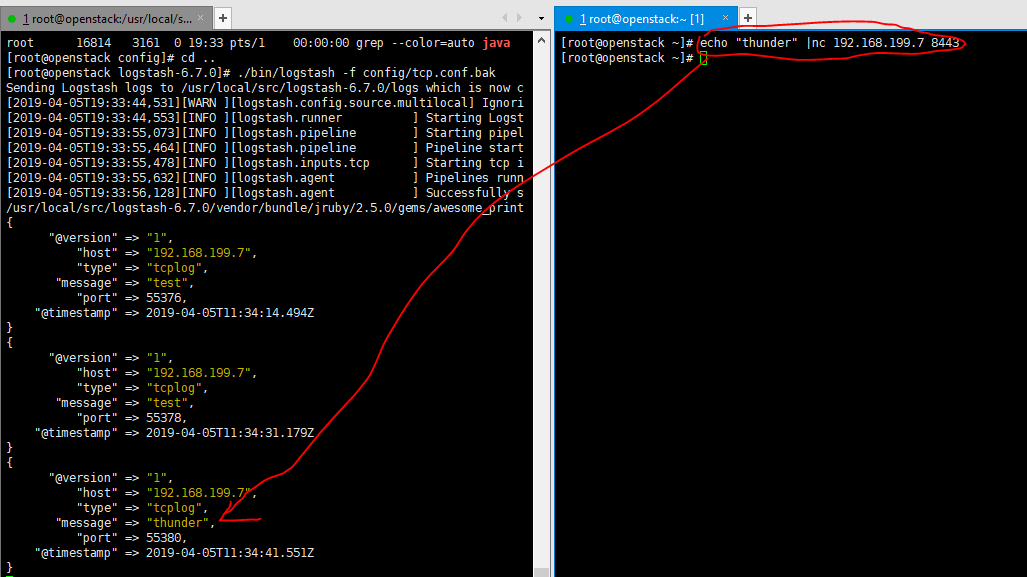

测试没有问题,此时需要把日志打到elasticsearch中。
修改一下配置文件:
[root@openstack logstash-6.7.0]# cat config/tcp.conf
input {
tcp {
port => "8443"
type => "tcplog-5612"
}
}
output {
elasticsearch {
hosts => ["192.168.199.7:9200"]
index => "tcplog-5612-%{+YYYY.MM.dd}"
}
}启动logstash服务
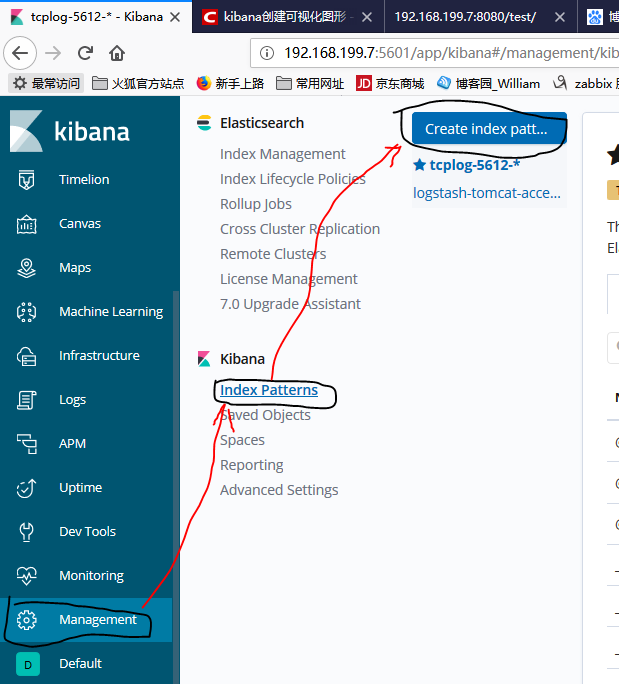
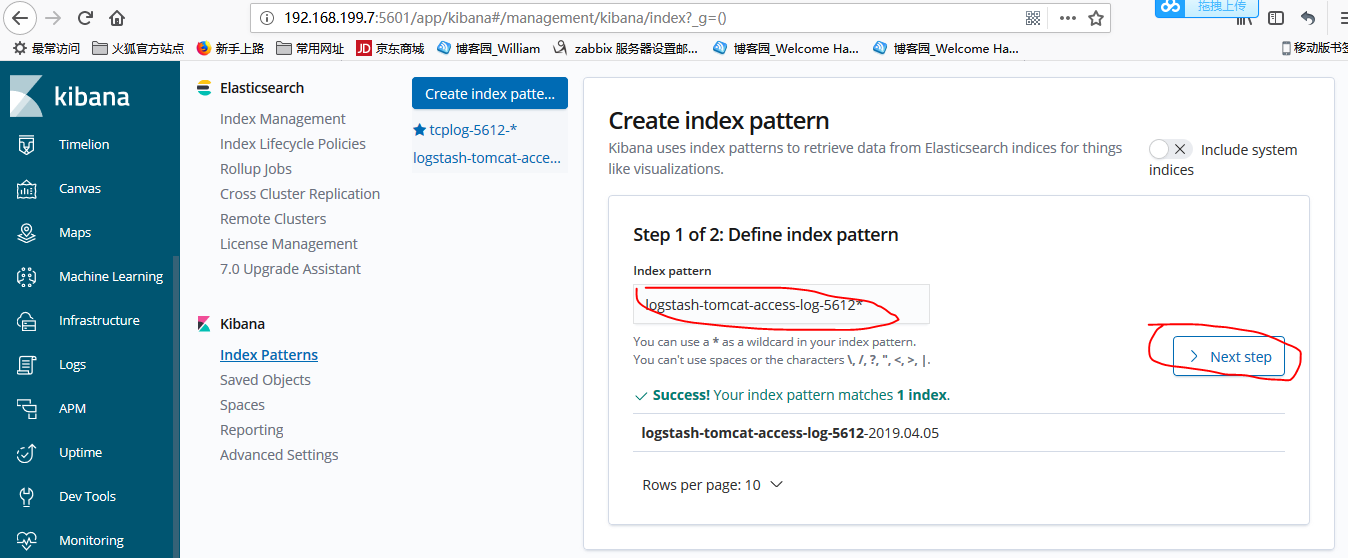
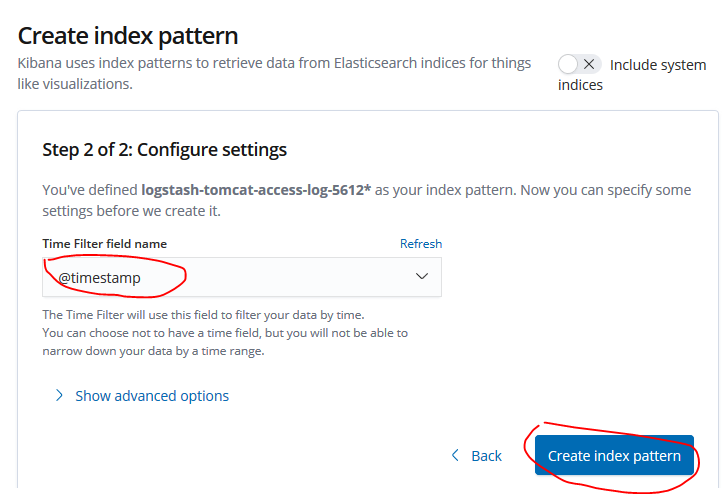
在kibana页面配置:
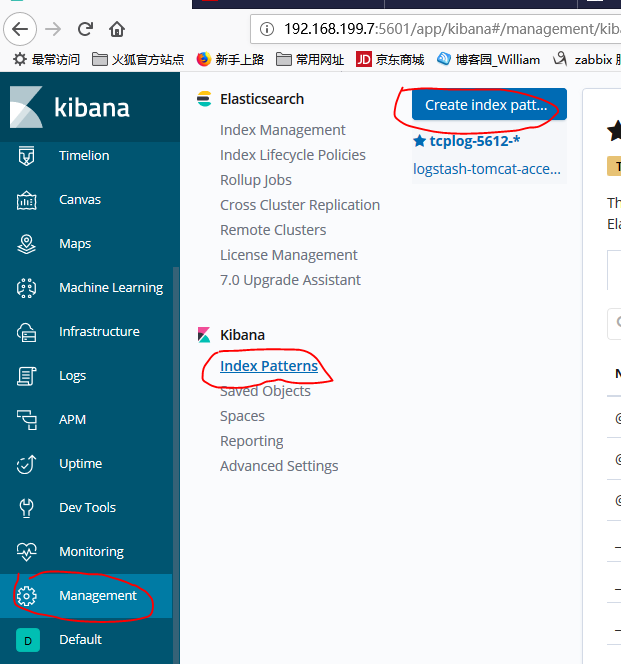
再次创建index。此时有之前创建的index,也有日志了。
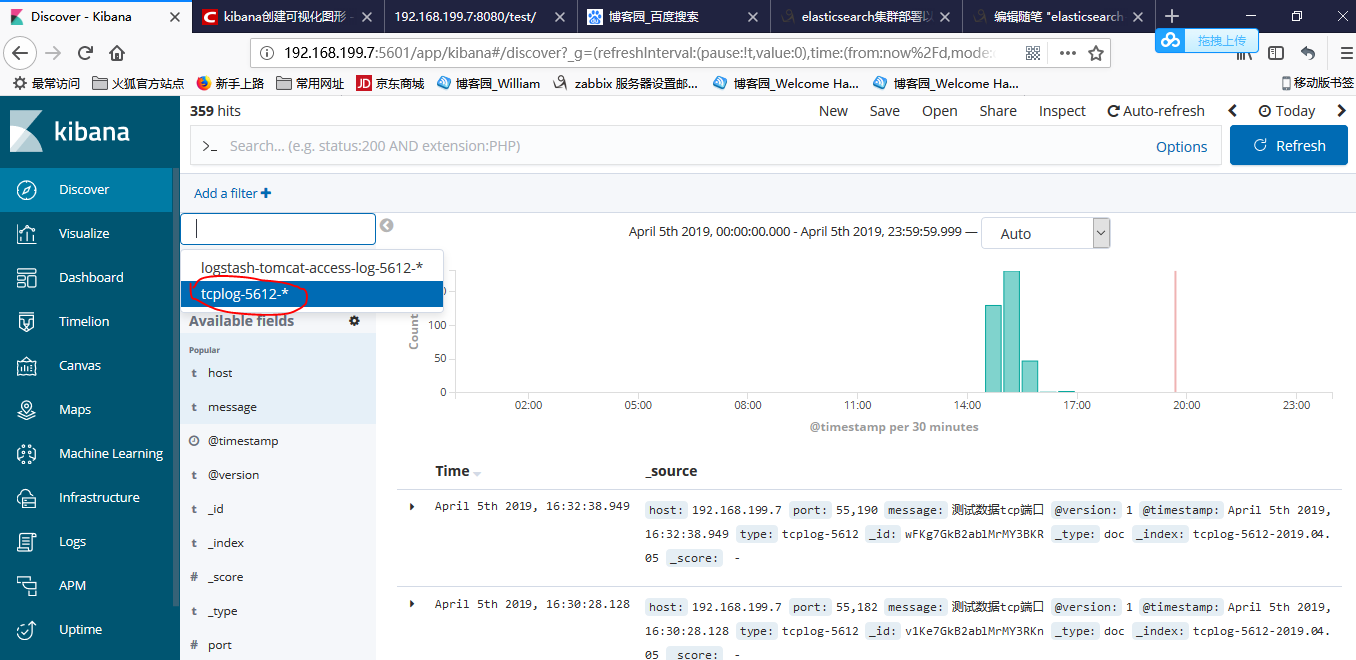
这样就OK了!!!!!!!!!!!
ES还有更加强大的功能,和诸位一起研究,学习。