SVG: scalable vector graphics
1、使用XML定义图形
2、图像可伸缩,尺寸更小,放大或者是改变尺寸时图片质量不会有所损失
3、除了IE需要安装插件,其他浏览器都支持SVG文件
4、svg文件需以.svg后缀保存
5、svg文件可以通过标签嵌入html文档:<embed>、<object>或者是<iframe>(注意使用object时不能使用脚本)
6、html5允许svg标签直接在HTML文件中使用
预定义形状:
<rect> : 矩形 x、y分别是距离左侧和顶端的位置;rx、ry用于产生圆角;fill-opacity和stroke-opacity分别定义填充颜色和笔触颜色的透明度

<circle>: cx、cy定义原点坐标(忽略时为0,0),r圆半径

<eclipse>:cx、cy原点坐标 rx、xy半径

<line>: x1、x2、y1、y2 x方向和开始和结束和y方向的开始和结束

<polyline>: points定义每个点的x左边和y坐标

<polygon>:多边形 同polyline用points定义坐标

<path> : 路径,稍微有点复杂如下: 大写表示绝对定位、小写表示相对定位

    M = moveto
    L = lineto
    H = horizontal lineto
    V = vertical lineto
    C = curveto
    S = smooth curveto
    Q = quadratic Belzier curve
    T = smooth quadratic Belzier curveto
    A = elliptical Arc
    Z = closepath
滤镜:
1、可在每个svg元素上定义多个滤镜,
2、需在<defs>标签中嵌套定义svg滤镜,将filter标签嵌套在defs中eg:
<defs>
<filter id = "gaus_blur">
<feGaussianBlur in="SourceGraphic" stdDeviation="3"/> //in定义由整个图像创建效果
</filter>
</defs>
3、用filter定义的同一滤镜可以被多个元素使用,使用时filter:url方式eg:引用上面的滤镜<filter="url(#gaus_blur)">
4、支持的滤镜如下:
feBlend
feColorMatrix
feComponentTransfer
feComposite
feConvolveMatrix
feDiffuseLighting
feDisplacementMap
feFlood
feGaussianBlur
feImage
feMerge
feMorphology
feOffset
feSpecularLighting
feTile
feTurbulence
feDistantLight
fePointLight
feSpotLight
渐变: 支持线性渐变和放射渐变
<linearGradient>:线性渐变,也是必须嵌套在<defs>标签中,x1,x2,y1,y2定义渐变的开始和结束
eg:
<defs>
<linearGradient id="orange_red" x1="0%" y1="0%" x2="100%" y2="0%">
<stop offset="0%" style="stop-color:rgb(255,255,0);stop-opacity:1"/>
<stop offset="100%" style="stop-color:rgb(255,0,0);stop-opacity:1"/>
</linearGradient>
</defs>

<ellipse cx="200" cy="190" rx="85" ry="55"
style="fill:url(#orange_red)"/>
<radialGradient>: 放射性渐变,也是必须嵌套在<defs>标签中
eg:
<defs>
<radialGradient id="grey_blue" cx="50%" cy="50%" r="50%"
fx="50%" fy="50%">
<stop offset="0%" style="stop-color:rgb(200,200,200);
stop-opacity:0"/>
<stop offset="100%" style="stop-color:rgb(0,0,255);
stop-opacity:1"/>
</radialGradient>
</defs>

<ellipse cx="230" cy="200" rx="110" ry="100"
style="fill:url(#grey_blue)"/>
例子:
eg1:svg文件形式
<?xml version="1.0">

<svg width="100%" height="100%" version="1.1"
xmlns="http://www.w3.org/2000/svg">

<circle cx="100" cy="50" r="40" stroke="black"
stroke-width="2" fill="red"/>

</svg>
//stroke控制轮廓
结果:红色圆,边线为黑色
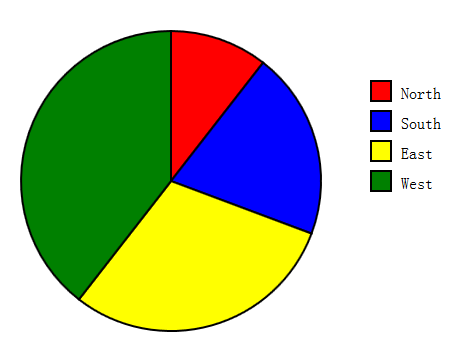
eg2:饼图:
/*
    创建一个svg元素,并在其中绘制一个饼图
    参数:
        data:用于绘制的数字类型的数组,数组的每一项都表示饼状图的一个栔
        width,height: SVG图形的高和宽,单位为像素
        cx、cy、r:饼状图的圆心及半径
        colors:包含html颜色信息的数组,每种颜色代表饼状图的每一个栔的颜色
        labels:标签数组,说明饼状图的每一个栔代表的含义
        lx、ly:饼状图的左上角
*/


function pieChart(data, width, height, cx, cy, r, colors, labels, lx, ly){
    //svg元素的xml命名空间
    var svgns = "http://www.w3.org/2000/svg";

    //创建svg元素
    var chart = document.createElementNS(svgns, "svg:svg");
    chart.setAttribute("width", width);
    chart.setAttribute("height", height);
    chart.setAttribute("viewBox", "0 0 " + width + " " + height); //viewBox为坐标系

    //累加data的值,以便于知道饼状图的大小
    var total = 0;
    for(var i = 0; i < data.length; i++){
        total += data[i];
    }

    //计算饼状图的每个分片的大小,角度以弧度制计算
    var angles = [];
    for(var i = 0; i < data.length; i++){
        angles[i] = data[i]/total*Math.PI*2;
    }

    //栔的开始位置和结束位置以及和圆交汇的两个点的坐标位置,12点钟放
    var startAngle = 0,
        endAngle,
        x1,
        y1,
        x2,
        y2;
    for(var i = 0; i < data.length; i++){
        endAngle = startAngle + angles[i];
        x1 = cx + r*Math.sin(startAngle);
        y1 = cy - r*Math.cos(startAngle);
        x2 = cx + r*Math.sin(endAngle);
        y2 = cy - r*Math.cos(endAngle);

        //判断角度是否大于半圆
        var big = 0;
        if(endAngle - startAngle > Math.PI){
            big = 1;
        }

        //使用<svg:path>描述栔,使用createElementNS创建该元素
        var path = document.createElementNS(svgns, "path");

        //设置路径
        var d = "M " + cx + "," + cy + " L " + x1 + "," + y1 + " A " + r + "," + r + " 0 " + big + " 1 " + x2 + "," + y2 + " Z";
        path.setAttribute("d", d);
        path.setAttribute("fill", colors[i]);
        path.setAttribute("stroke", "black");
        path.setAttribute("stroke-width", "2");
        chart.appendChild(path);

        //下一个栔从此处开始
        startAngle = endAngle;

        //绘制小方格表示图例
        var icon = document.createElementNS(svgns, "rect");
        icon.setAttribute("x", lx);
        icon.setAttribute("y", ly + 30*i);
        icon.setAttribute("width", 20);
        icon.setAttribute("height", 20);
        icon.setAttribute("fill", colors[i]);
        icon.setAttribute("stroke", "black");
        icon.setAttribute("stroke-width", "2");
        chart.appendChild(icon);

        //为右边的小方格添加标签
        var label = document.createElementNS(svgns, "text");
        label.setAttribute("x", lx + 30);
        label.setAttribute("y", ly + 30*i + 18);
        label.setAttribute("font-family", "sans-serif");
        label.setAttribute("font-size", "16");

        label.appendChild(document.createTextNode(labels[i]));
        chart.appendChild(label);
    }

    return chart;

}
<body onload = "document.body.appendChild(pieChart([12,23,34,45], 640, 400, 200, 200, 150,['red', 'blue', 'yellow', 'green'],['North', 'South', 'East', 'West'],400,100))">
结果:
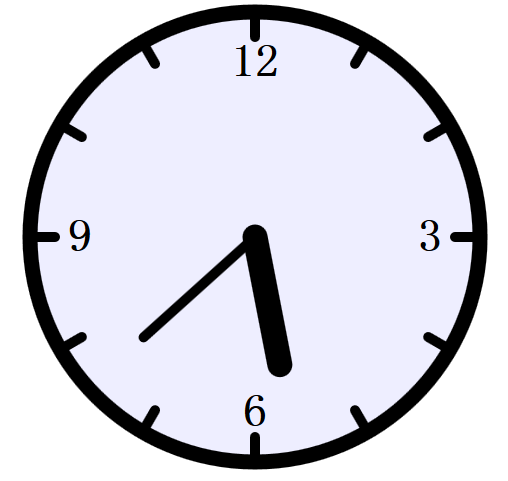
eg3:时钟:
function svgClock(){
    var now = new Date();
    var min = now.getMinutes();
    var hour = (now.getHours() % 12) + min/60;
    var minAngle = min * 6; //每6度一分钟
    var hourAngle = hour * 30; //每30度一小时

    var minHand  = document.getElementById("minuteHand");
    var hourHand = document.getElementById("hourHand");
    var clock = document.getElementById("clock");

    minHand.setAttribute("transform", "rotate(" + minAngle + ",50,50)");
    hourHand.setAttribute("transform", "rotate(" + hourAngle + ",50,50)");
    clock.setAttribute("fill","#eef" );

    //每一分钟更新下时间
    setTimeout(svgClock, 60000);
}
#clock {
    stroke: black;  /*stroke定义轮廓颜色*/
    stroke-linecap: round;  /*圆角*/
    fill: #eef; /*浅蓝色背景*/
}

#face {
    stroke-width : 3px; /*时钟的外边框*/
}

#ticks {
    stroke-width: 2; /*标记每个小时的线段*/
}

#hourHand {
    stroke-width: 5px;.
}

#minuteHand {
    stoke-width: 3px;
}

#numbers {
    font-family: sans-resif;
    font-size: 7pt;
    font-weight: bold;

    text-anchor: middle;
    stroke: none;
    fill: black;
}
<body onload="svgClock()">
    <svg id="clock" viewBox="0 0 100 100" width="500" height="500">
        <defs>
            <filter id="shadow" x="-50%" y="-50%" width="500" height="500">
                <feGaussianBlur in="SourceAlpha" stdDeviation="1" result="blur"> <!-- 设置滤镜 -->
                <feOffset in="blur" dx="1" dy="1" result="shadow"/>
                <feMerge>
                    <feMergeNode in="SourceGraphic"/>
                    <feMergeNode in="shadow"/>
                </feMerge>
            </filter>
        </defs>

        <circle id="face" cx="50" cy="50" r="45"/> <!-- 钟面 -->

        <g id="ticks">  <!-- 12小时的刻度 g用于将元素组合 -->
            <line x1="50" y1="5.000" x2="50.00" y2="10.00"/>
            <line x1="72.50" y1="11.03" x2="70.00" y2="15.36"/>
            <line x1="88.97" y1="27.50" x2="84.64" y2="30.00"/>
            <line x1="95.00" y1="50.00" x2="90.00" y2="50.00"/>
            <line x1="88.97" y1="72.50" x2="84.64" y2="70.00"/>
            <line x1="72.50" y1="88.97" x2="70.00" y2="84.64"/>
            <line x1="50.00" y1="95.00" x2="50.00" y2="90.00"/>
            <line x1="27.50" y1="88.97" x2="30.00" y2="84.64"/>
            <line x1="11.03" y1="72.50" x2="15.36" y2="70.00"/>
            <line x1="5.000" y1="50.00" x2="10.00" y2="50.00"/>
            <line x1="11.03" y1="27.50" x2="15.36" y2="30.00"/>
            <line x1="27.50" y1="11.03" x2="30.00" y2="15.36"/>
        <g/>

        <g id="numbers"> <!-- 标记重要的刻度值,3,6,9,12等 -->
            <text x="50" y="18">12</text>
            <text x="85" y="53">3</text>
            <text x="50" y="88">6</text>
            <text x="15" y="53">9</text>
        </g>

        <g id="hands" > <!-- 初始绘制成竖直的指针,之后通js旋转,并且给指针加上阴影 -->
            <line id="hourHand"  x1="50" y1="50" x2="50" y2="24"/>
            <line id="minuteHand"  x1="50" y1="50" x2="50" y2="20"/>
        </g>
    </svg>
</body>
结果: