HTML5 Canvas 画布
版权声明:未经博主授权,内容严禁转载 !
什么是 Canvas
Canvas 是 HTML5 新推出的元素标签,用户图形绘制。
和所有 DOM 元素一样,拥有自己的属性、方法和事件,其中包含绘图的方法。
通过 JavaScript 脚本可以调用绘图 API 在网页上完成绘图功能。
Canvas 是 HTML5 中最强大的特性之一。
允许开发者使用动态和交互的方法,在 Web 上实现桌面应用程序的功能。
注意:IE8 及更早的 IE浏览器不支持 Canvas 标签。
创建 Canvas
Canvas 元素可以在网页中创建一个空白的矩形区域。
通过 API(JavaScript)可以操作这个区域。
默认情况下,创建的 Canvas 元素没有边框和内容。
语法
< canvas id = " canvas " width = " 300 " height = " 320 " > </canvas>
<style media="screen">
  canvas{
    border: 1px solid #888888;
  }
</style>
<canvas id="canvas" width="300" height="300"></canvas>

getContext() 方法
在使用 canvas 元素的时候,需要调用 getContext() 方法,目的是得到画布的绘图上下文。通过这个阴影,就可以使用其他的 API 进行绘图操作。
语法

2d :平面的 ,主要讲解2d。
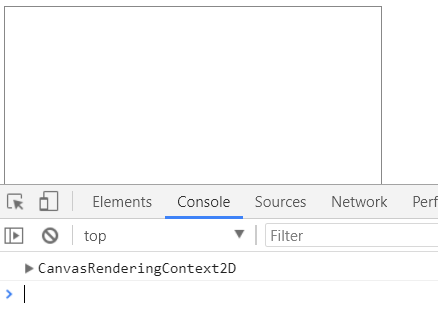
案例代码
<style media="screen">
  canvas{
    border: 1px solid #888888;
  }
</style>
<canvas id="canvas" width="300" height="300"></canvas>

<script type="text/javascript">

  window.onload = initial;

  function initial() {
    var elem = document.getElementById("canvas");
    var canvas = elem.getContext("2d");
    console.log(canvas);
  }
</script>
绘制矩形
准备好 canvas 之后,就可以创建绘制图形了。
canvas API 提供了多种工具,包括创建图形、颜色、图像、文本等。
canvas API 中的一些方法支持直接在画布上绘制图形。
绘制矩形的方法
- fillRect( x , y , width , height )
- strokeRect( x , y , width , height )
- clearRect( x , y , width , height )

* fillRect( x , y , width , height )
- 绘制实心矩形。
- x ,y 指的是矩形左上角的位置。
- width,height 表明其尺寸大小。
* strokeRect( x , y , width , height )
- 绘制空心矩形。
* clearRect( x , y , width , height )
- 清除属性所指定的区域的像素,类似于擦除器。

案例代码
<style media="screen">
  canvas{
    border: 1px solid #888888;
  }
</style>

<canvas id="canvas" width="320" height="320"></canvas>

<script type="text/javascript">
  window.onload = initial;
  function initial() {
    var elem = document.getElementById("canvas");
    var canvas = elem.getContext("2d");
    canvas.strokeRect(100,100,120,120);  // 绘制空心矩形
    canvas.fillRect(110,110,100,100); // 绘制实心矩形
    canvas.clearRect(120,120,80,80); // 擦除矩形
  }
</script>

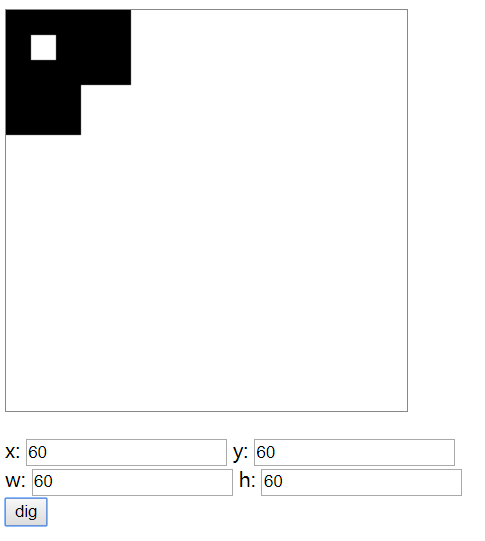
案例:在画布上扣出小矩形
<style media="screen">
  canvas{
    border: 1px solid #888888;
  }
</style>

<canvas id="canvas" width="320" height="320"></canvas>

<p>
  x:
  <input id="x" type="text" name="" value="">
  y:
  <input id="y" type="text" name="" value=""><br>
  w:
  <input id="w" type="text" name="" value="">
  h:
  <input id="h" type="text" name="" value=""><br>
  <button onclick="dig()" type="button" name="button">dig</button>
</p>

<script type="text/javascript">
  window.onload = initial;
  var elem = document.getElementById("canvas");
  var canvas = elem.getContext("2d");
  function initial() {
    canvas.fillRect(0,0,100,100); // 画一个矩形
  }
  function dig() {
    var x = parseInt(document.getElementById('x').value) ;
    var y = parseInt(document.getElementById('y').value) ;
    var w = parseInt(document.getElementById('w').value) ;
    var h = parseInt(document.getElementById('h').value) ;
    canvas.clearRect(x,y,w,h);
  }
</script>
绘制颜色
在创建图形时如果不设定颜色,所有的图形都会使用默认颜色 - 纯黑色。
可以通过以下属性指定绘图颜色:
- strokeStyle :声明形状线条的颜色。
- fillStyle:声明形状内部区域颜色。
- globalAlpha:透明度属性,可以设置画布上图形的透明度。

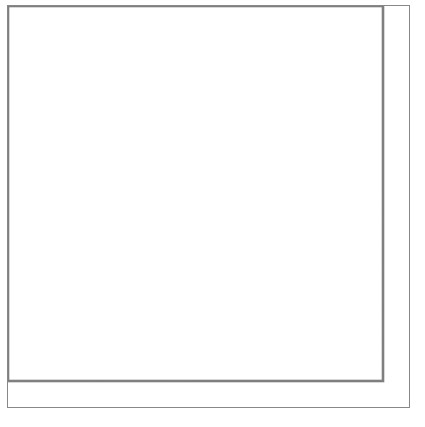
案例代码
<style media="screen">
  canvas{
    border: 1px solid #888888;
  }
</style>

<canvas id="canvas" width="320" height="320"></canvas>


<script type="text/javascript">
  window.onload = initial;
  var elem = document.getElementById("canvas");
  var canvas = elem.getContext("2d");
  function initial() {
    canvas.strokeStyle = "ff0000";
    canvas.strokeRect(0,0,300,300); // 画一个矩形
  }

</script>
练习:
- 绘制不同位置、不同颜色的矩形。
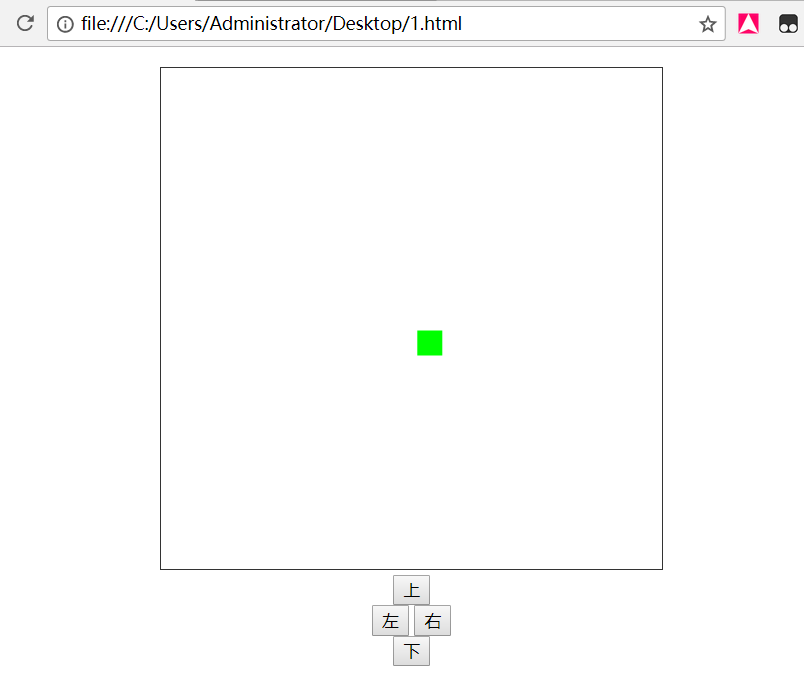
- 移动矩形
<style media="screen">
  p.center{
    text-align: center;
  }
  canvas{
    border: 1px solid #333333;
  }
</style>


<p class="center">
  <canvas id="canvas" width="400" height="400"></canvas><br>
  <button id="up" type="button" name="button">上</button><br>
  <button id="left" type="button" name="button">左</button>
  <button id="right" type="button" name="button">右</button><br>
  <button id="down" type="button" name="button">下</button>
</p>

<script type="text/javascript">
  var elem =document.getElementById("canvas");
  var cvs = elem.getContext('2d');
  var x = 190;
  var y = 190;
  window.onload  = initial;
  function initial() {
    cvs.fillRect(x,y,20,20);
  }

  var t;
  var up = document.getElementById("up");
  up.addEventListener("mouseover",function () {  // 设置鼠标移上按钮事件
    t = setInterval(drawup,100);  // 设置一个定时器
  },true);
  up.addEventListener("mouseout",function () {  // 设置鼠标移出按钮事件
    t = clearInterval(t);  // 清空定时器
  },true);
  function drawup() {
    cvs.fillStyle = "#ff0000";
    cvs.clearRect(x,y,20,20);
    y -= 5;
    cvs.fillRect(x,y,20,20);
  }

  var down = document.getElementById("down");
  down.addEventListener("mouseover",function () {  // 设置鼠标移上按钮事件
    t = setInterval(drawdown,100);  // 设置一个定时器
  },true);
  down.addEventListener("mouseout",function () {  // 设置鼠标移出按钮事件
    t = clearInterval(t);  // 清空定时器
  },true);
  function drawdown() {
    cvs.fillStyle = "#00ff00";
    cvs.clearRect(x,y,20,20);
    y += 5;
    cvs.fillRect(x,y,20,20);
  }

  var left = document.getElementById("left");
  left.addEventListener("mouseover",function () {  // 设置鼠标移上按钮事件
    t = setInterval(drawleft,100);  // 设置一个定时器
  },true);
  left.addEventListener("mouseout",function () {  // 设置鼠标移出按钮事件
    t = clearInterval(t);  // 清空定时器
  },true);
  function drawleft() {
    cvs.fillStyle = "#00ff";
    cvs.clearRect(x,y,20,20);
    x -= 5;
    cvs.fillRect(x,y,20,20);
  }

  var right = document.getElementById("right");
  right.addEventListener("mouseover",function () {  // 设置鼠标移上按钮事件
    t = setInterval(drawright,100);  // 设置一个定时器
  },true);
  right.addEventListener("mouseout",function () {  // 设置鼠标移出按钮事件
    t = clearInterval(t);  // 清空定时器
  },true);
  function drawright() {
    cvs.fillStyle = "#00ffff";
    cvs.clearRect(x,y,20,20);
    x += 5;
    cvs.fillRect(x,y,20,20);
  }

</script>
渐变
canvas 支持的渐变效果包括线性渐变和射线渐变。
canvas 渐变支持设置颜色的转折点。
语法
- createLinearGradient ( x1, y1, x2, y2 ) :创建线性渐变
- createRadialGradient ( x1, y1, r1, x2, y2, r2 ) :创建射线渐变
- createColorStop ( position,color ) :指定渐变颜色
渐变 - 线性渐变

案例代码:
<style media="screen">
  canvas{
    border: 1px solid #333333;
  }
</style>

<canvas id="canvas" width="320" height="320"></canvas>

<script type="text/javascript">
  window.onload = initial;
  function initial() {
    var ele = document.getElementById("canvas");
    var cvs = ele.getContext('2d');

    var grad = cvs.createLinearGradient(0,0,320,0);  // 渐变方向,前两个是第一个点,后两个是第二个点坐标
    grad.addColorStop(0,"#ff0000");
    grad.addColorStop(0.5,"#ffff00");
    grad.addColorStop(1,"#ffffff");
    cvs.fillStyle = grad;
    cvs.fillRect(0,0,320,320);
  }
</script>

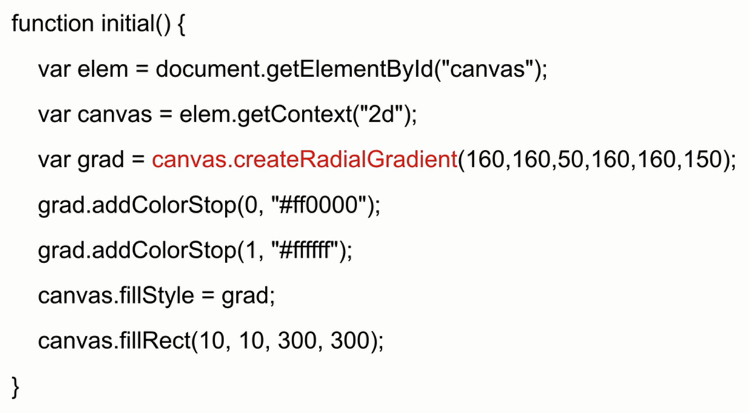
渐变 - 径向渐变 (射线渐变)
案例代码
<style media="screen">
  canvas{
    border: 1px solid #333333;
  }
</style>

<canvas id="canvas" width="320" height="320"></canvas>

<script type="text/javascript">
  window.onload = initial;
  function initial() {
    var ele = document.getElementById("canvas");
    var cvs = ele.getContext('2d');

    var grad = cvs.createRadialGradient(160,160,50,160,160,150); // 前三个表示第一个圆形的圆心坐标和半径,后三个表示第二个圆形的圆心坐标和半径
    grad.addColorStop(0,"#ff0000");
    grad.addColorStop(0.5,"#ffff00");
    grad.addColorStop(1,"#ffffff");
    cvs.fillStyle = grad;
    cvs.fillRect(0,0,320,320);
  }
</script>

绘制文字
在画布上写文字非常简单,只需要定义一些属性和方法即可。
属性:
- font :与 css 和 font 的属性类似,接受值也完全相同。
- textAlign :文本对齐方式,值可以是 left、right 和 center。
- textBaseline:文本基线,值可以是 top(顶部对齐)、hanging(基线对齐)、middle(中部对其)、alphabetic(默认对其方式) 和 bottom(底部对齐)。
方法:
- strokeText(text,x,y):在位置(x,y)处绘制指定的文字轮廓。
- fillText(text,x,y ):与上一个方法相似,区别是该方法绘制的是实心的文字。
- measureText():返回指定文字大小信息。

案例代码
<style media="screen">
  canvas{
    border: 1px solid #333333;
  }
</style>

<canvas id="canvas" width="320" height="320"></canvas>

<script type="text/javascript">
  window.onload = initial;
  function initial() {
    var ele = document.getElementById("canvas");
    var cvs = ele.getContext("2d");
    cvs.font = "bold 48px verdana,sans-serif";
    cvs.textAlign = "left";
    cvs.textBaseline = "bottom";

    var size =cvs.measureText("Wang");  // 返回指定文字大小信息
    var grad = cvs.createLinearGradient(0,0,size.width,48); // 线性渐变
    grad.addColorStop(0,"#ff0000");
    grad.addColorStop(1,"#ffffff");
    cvs.fillStyle = grad;

    cvs.strokeText("Wang",40,80);  // 绘制文字边框
    cvs.fillText("Wang",40,80);  // 填充文本
    cvs.strokeRect(40,32,size.width,48);  // 绘制一个外边框
  }
</script>

绘制阴影
阴影也是 canvas API 的重要组成部分。
每一条路径和文字都可以创建阴影效果。
API 提供了4个实现阴影的属性:
- shadowColor:阴影的颜色。
- shadowOffsetX:确定阴影的水平投射距离。
- shadowOffsetY:确定阴影的垂直投射距离。
- shadowBlur:模糊效果。
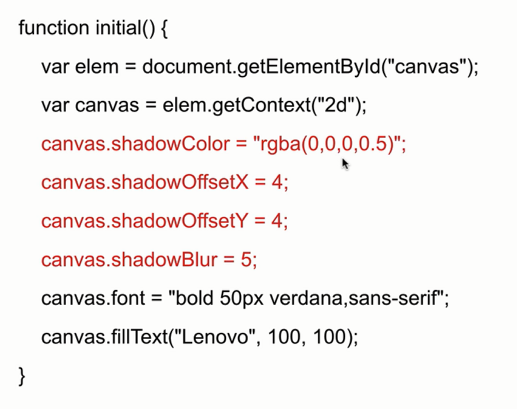
注: rgba(0,0,0,0.5) // 最后的0.5表示半透明,透明度为0.5。shadowBlur 为羽化程度即模糊度,值越高,羽化程度越高。
案例代码
<style media="screen">
  canvas{
    border: 1px solid #333333;
  }
</style>

<canvas id="canvas" width="300" height="300"></canvas>

<script type="text/javascript">
  window.onload = initial;
  function initial() {
    var ele = document.getElementById("canvas");
    var cvs = ele.getContext("2d");

    cvs.shadowColor = "rgba(255,0,0,0.5)";  // 设置阴影颜色 0.5是透明度
    cvs.shadowOffsetX = 5;  // 设置x轴偏移像素
    cvs.shadowOffsetY = 5;  // 设置y轴偏移像素
    cvs.shadowBlur = 5;  // 设置羽化程度

    cvs.fillStyle = "#ff0000";  // 设置文本填充颜色

    cvs.font = "bold 50px verdana, sans-serif";  // 设置文本字体
    var size = cvs.measureText("wang");  // 获取字体大小

    cvs.fillText("wang",(300 - size.width)/2,100);  // 写实心字体

  }
</script>

Canvas 绘制路径
针对一些复杂图形的绘制,需要通过路径进行描绘。
路径是画笔移动的地图,路径建立后,将其发送给上下文,就可以绘制图形。
Canvas 绘制路径 - 常用方法
beginPath()
- 开始一个新的形状描。穿件路径前必须先调用该方法。
closePath()
- 关闭路径,用直线将最后一个点与远点相连,如果想要保留开放路径,则不需要调用该方法。
stroke()
- 将路径绘制为轮廓形状。
fill()
- 将路径绘制为实心形状,使用该方法是可以不用 closePath 关闭路径。该方法会通过直线连接最后一个点与第一个点实现封闭。
clip()
- 在上下文中设置剪裁区域。
moveTo( x, y )
- 将笔触移动到指定位置。
lineTo( x, y )
- 绘制一条直线,连接当前笔触位置到指定位置。
rect( x, y, width, height )
- 生成一个矩形路径。
arc( x, y, radius, startAngle, endAngle, direction )
- 在指定位置上生成弧线或圆线,半径和弧度由属性指定。
- direction 是布尔类型,表示顺时针或逆时针。
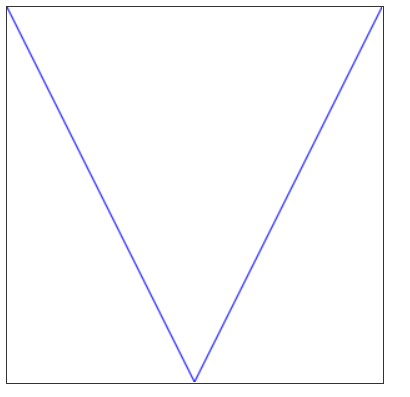
案例:
画一个 V 字形线条
<style media="screen">
  canvas{
    border: 1px solid #333333;
  }
</style>

<canvas id="cvs" width="300" height="300"></canvas>

<script type="text/javascript">

  var cvs = document.getElementById("cvs");
  var ctx = cvs.getContext("2d");

  ctx.beginPath();
  ctx.moveTo(0,0);
  ctx.lineTo(150,300);
  // ctx.strokeStyle ="#ff0000";  // 设置颜色
  // ctx.stroke();
  // ctx.closePath();

  // ctx.beginPath();
  // ctx.moveTo(150,300);
  ctx.lineTo(300,0);
  ctx.strokeStyle ="#0000ff";  // 设置颜色
  ctx.stroke();
  ctx.closePath();

</script>
案例:
绘制矩形
<style media="screen">
  canvas{
    border: 1px solid #333333;
  }
</style>

<canvas id="cvs" width="300" height="300"></canvas>

<script type="text/javascript">
  var cvs = document.getElementById("cvs");
  var ctx = cvs.getContext("2d");

  ctx.beginPath();
  ctx.moveTo(100,100);
  ctx.lineTo(100,200);
  ctx.lineTo(200,200);
  ctx.lineTo(200,100);
  // ctx.closePath();  // 闭合,将终点和起点连接起来
  ctx.fillStyle = "#ff0000" // 设置填充的颜色
  ctx.fill();  // 填充图形 填充的是闭合的图形,如果不是闭合,自动闭合,如同加上了 ctx.closePath();
  ctx.stroke();  // 绘制

</script>

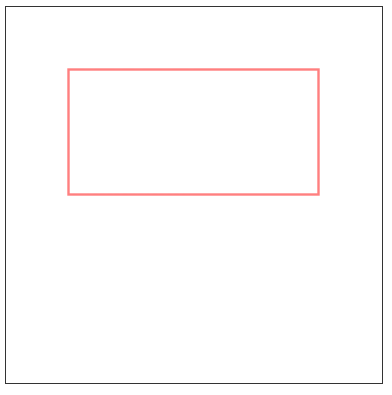
绘制矩形简单灵活案例
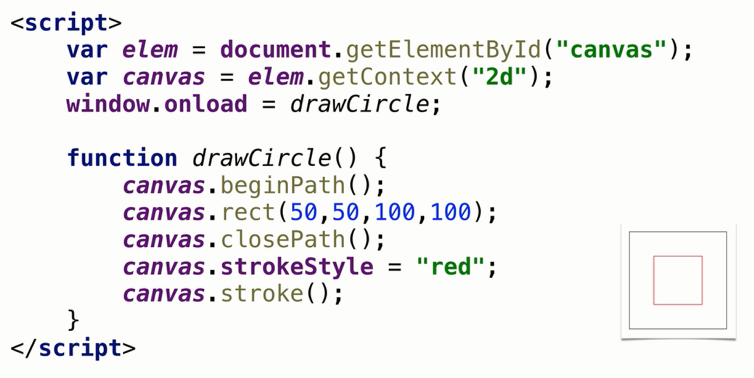
<style media="screen">
  canvas{
    border: 1px solid #333333;
  }
</style>

<canvas id="cvs" width="300" height="300"></canvas>

<script type="text/javascript">
  var cvs = document.getElementById("cvs");
  var ctx = cvs.getContext("2d");

  ctx.beginPath();
  ctx.rect(50,50,200,100);
  // ctx.closePath();
  ctx.strokeStyle = "red";
  ctx.stroke();

</script>
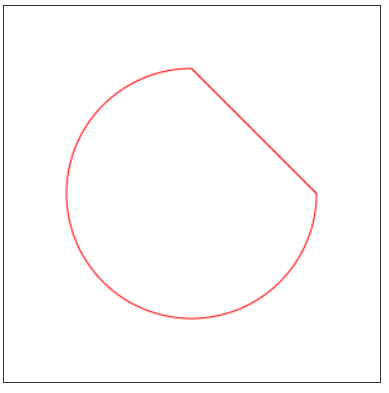
Canvas 绘制路径 - 弧形

注意: arc(100,100,50,0,1.5*Math.PI) 前三个参数为:中心点坐标和半径,0代表开始的角度,PI为圆周率,一个圆圈为 2 * π , 1.5 * Math.PI 表示 3/4个圆弧。亲,注意了哈,本来不打算解释的,但是我知道你会忘记,我太了解你了,你看,学了又怎么样,不还是得来找答案吗!哈哈哈哈,没关系,加油咯!
<style media="screen">
  canvas{
    border: 1px solid #333333;
  }
</style>

<canvas id="cvs" width="300" height="300"></canvas>

<script type="text/javascript">
  var cvs = document.getElementById("cvs");
  var ctx = cvs.getContext("2d");

  ctx.beginPath();
  ctx.arc(150,150,100,0,Math.PI * 1.5);
  // ctx.closePath();
  ctx.closePath(); // 关闭线条
  ctx.strokeStyle = "red";
  ctx.stroke();

</script>
Canvas 线性路径
画布默认使用的线性使用的相同的线型。
实际上线条的宽度、端点都可以根据实际绘图需要进行调整。
修改线型属性:
- lineWidth :指定线条的粗细,默认值是 1.0 。
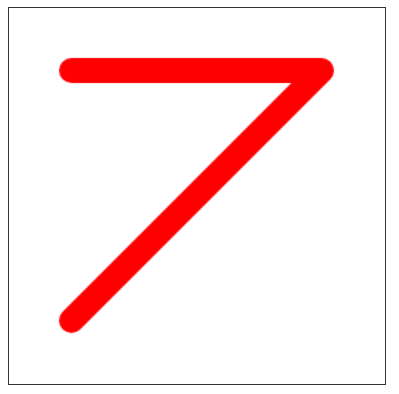
案例:
<style media="screen">
  canvas{
    border: 1px solid #333333;
  }
</style>

<canvas id="cvs" width="300" height="300"></canvas>

<script type="text/javascript">
  var cvs = document.getElementById("cvs");
  var ctx = cvs.getContext("2d");

  ctx.beginPath();
  ctx.lineWidth = "10";
  ctx.moveTo(50,50);
  ctx.lineTo(250,50);
  // ctx.closePath();
  ctx.strokeStyle = "red";
  ctx.stroke();

</script>

lineCap :指定线条端点的形状,支持的值有以下三个:
- butt (默认):向线条的每个末端添加平直的边缘。
- round:向线条的每个末端添加圆形线帽。
- square:向线条的每个末端添加正方形线帽。
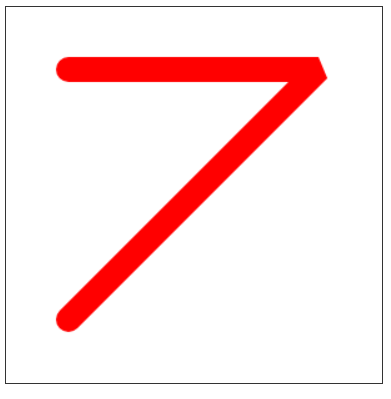
案例:
<style media="screen">
  canvas{
    border: 1px solid #333333;
  }
</style>

<canvas id="cvs" width="300" height="300"></canvas>

<script type="text/javascript">
  var cvs = document.getElementById("cvs");
  var ctx = cvs.getContext("2d");

  ctx.beginPath();
  ctx.lineWidth = "10";
  ctx.lineCap = "round"
  ctx.moveTo(50,50);
  ctx.lineTo(250,50);
  // ctx.closePath();
  ctx.strokeStyle = "red";
  ctx.stroke();

</script>

lineJoin :指定两条线之间的连接点形状。
- round:创建圆角。
- bevel:创建斜角。
- miter(默认):创建尖角。
案例:
<style media="screen">
  canvas{
    border: 1px solid #333333;
  }
</style>

<canvas id="cvs" width="300" height="300"></canvas>

<script type="text/javascript">
  var cvs = document.getElementById("cvs");
  var ctx = cvs.getContext("2d");

  ctx.beginPath();
  ctx.lineWidth = "20";
  ctx.lineCap = "round"
  ctx.moveTo(50,50);
  ctx.lineTo(250,50);
  // ctx.closePath();
  ctx.strokeStyle = "red";
  ctx.lineJoin = "round";  // 设置交界处圆角
  ctx.lineTo(50,250);
  ctx.stroke();

</script>
miterLimit
- 与 lineJoin 一起使用。
- 当 lineJoin 设置为 miter 时,可用于确定线条交接点的延伸范围。
案例
<style media="screen">
  canvas{
    border: 1px solid #333333;
  }
</style>

<canvas id="cvs" width="300" height="300"></canvas>

<script type="text/javascript">
  var cvs = document.getElementById("cvs");
  var ctx = cvs.getContext("2d");

  ctx.beginPath();
  ctx.lineWidth = "20";
  ctx.lineCap = "round"
  ctx.moveTo(50,50);
  ctx.lineTo(250,50);
  // ctx.closePath();
  ctx.strokeStyle = "red";
  ctx.lineJoin = "miter";  // 设置交界处
  ctx.miterLimit = 1;
  ctx.lineTo(50,250);
  ctx.stroke();

</script>
练习:绘制柱状统计图
<style media="screen">
  canvas{
    border: 1px solid #333333;
  }
</style>

<canvas id="cvs" width="400" height="300"></canvas>

<script type="text/javascript">
  var cvs = document.getElementById("cvs");
  var ctx = cvs.getContext("2d");

  ctx.beginPath();
  ctx.lineWidth = 1;
  ctx.moveTo(50,50);
  ctx.lineTo(50,250);
  ctx.lineTo(350,250);
  ctx.stroke();

  ctx.beginPath();
  ctx.lineWidth = 20;
  ctx.strokeStyle="red";
  ctx.moveTo(100,250);
  ctx.lineTo(100,150);
  ctx.stroke();

  ctx.beginPath();
  ctx.lineWidth = 20;
  ctx.strokeStyle="blue";
  ctx.moveTo(150,250);
  ctx.lineTo(150,200);
  ctx.stroke();

</script>

处理 Canvas 中的图像
HTML5 中,不仅可以使用 Canvas 绘制图形,还可以读取文件,然后使用 Canvas 将图像绘制在画布上。
绘制图像的方法:
- drawImage(image,x,y) // 第一个是图片文件,x,y为左上角坐标
- drawImage(image,x,y,w,h)

平铺图像
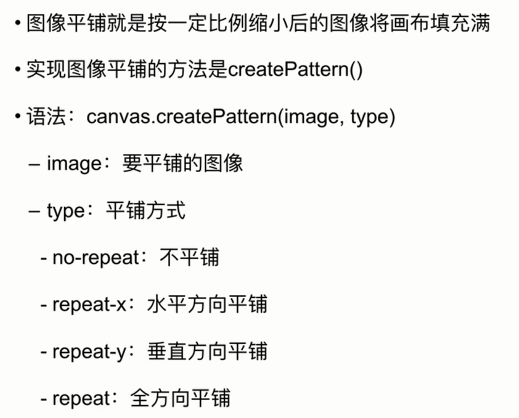
案例

切割元素
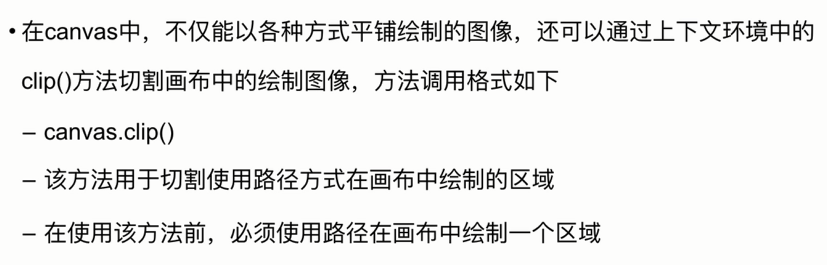
案例
