Adaboost:多个弱分类器组成一个强分类器,按照每个弱分类器的作用大小给予不同的权重
|
一.Adaboost理论部分
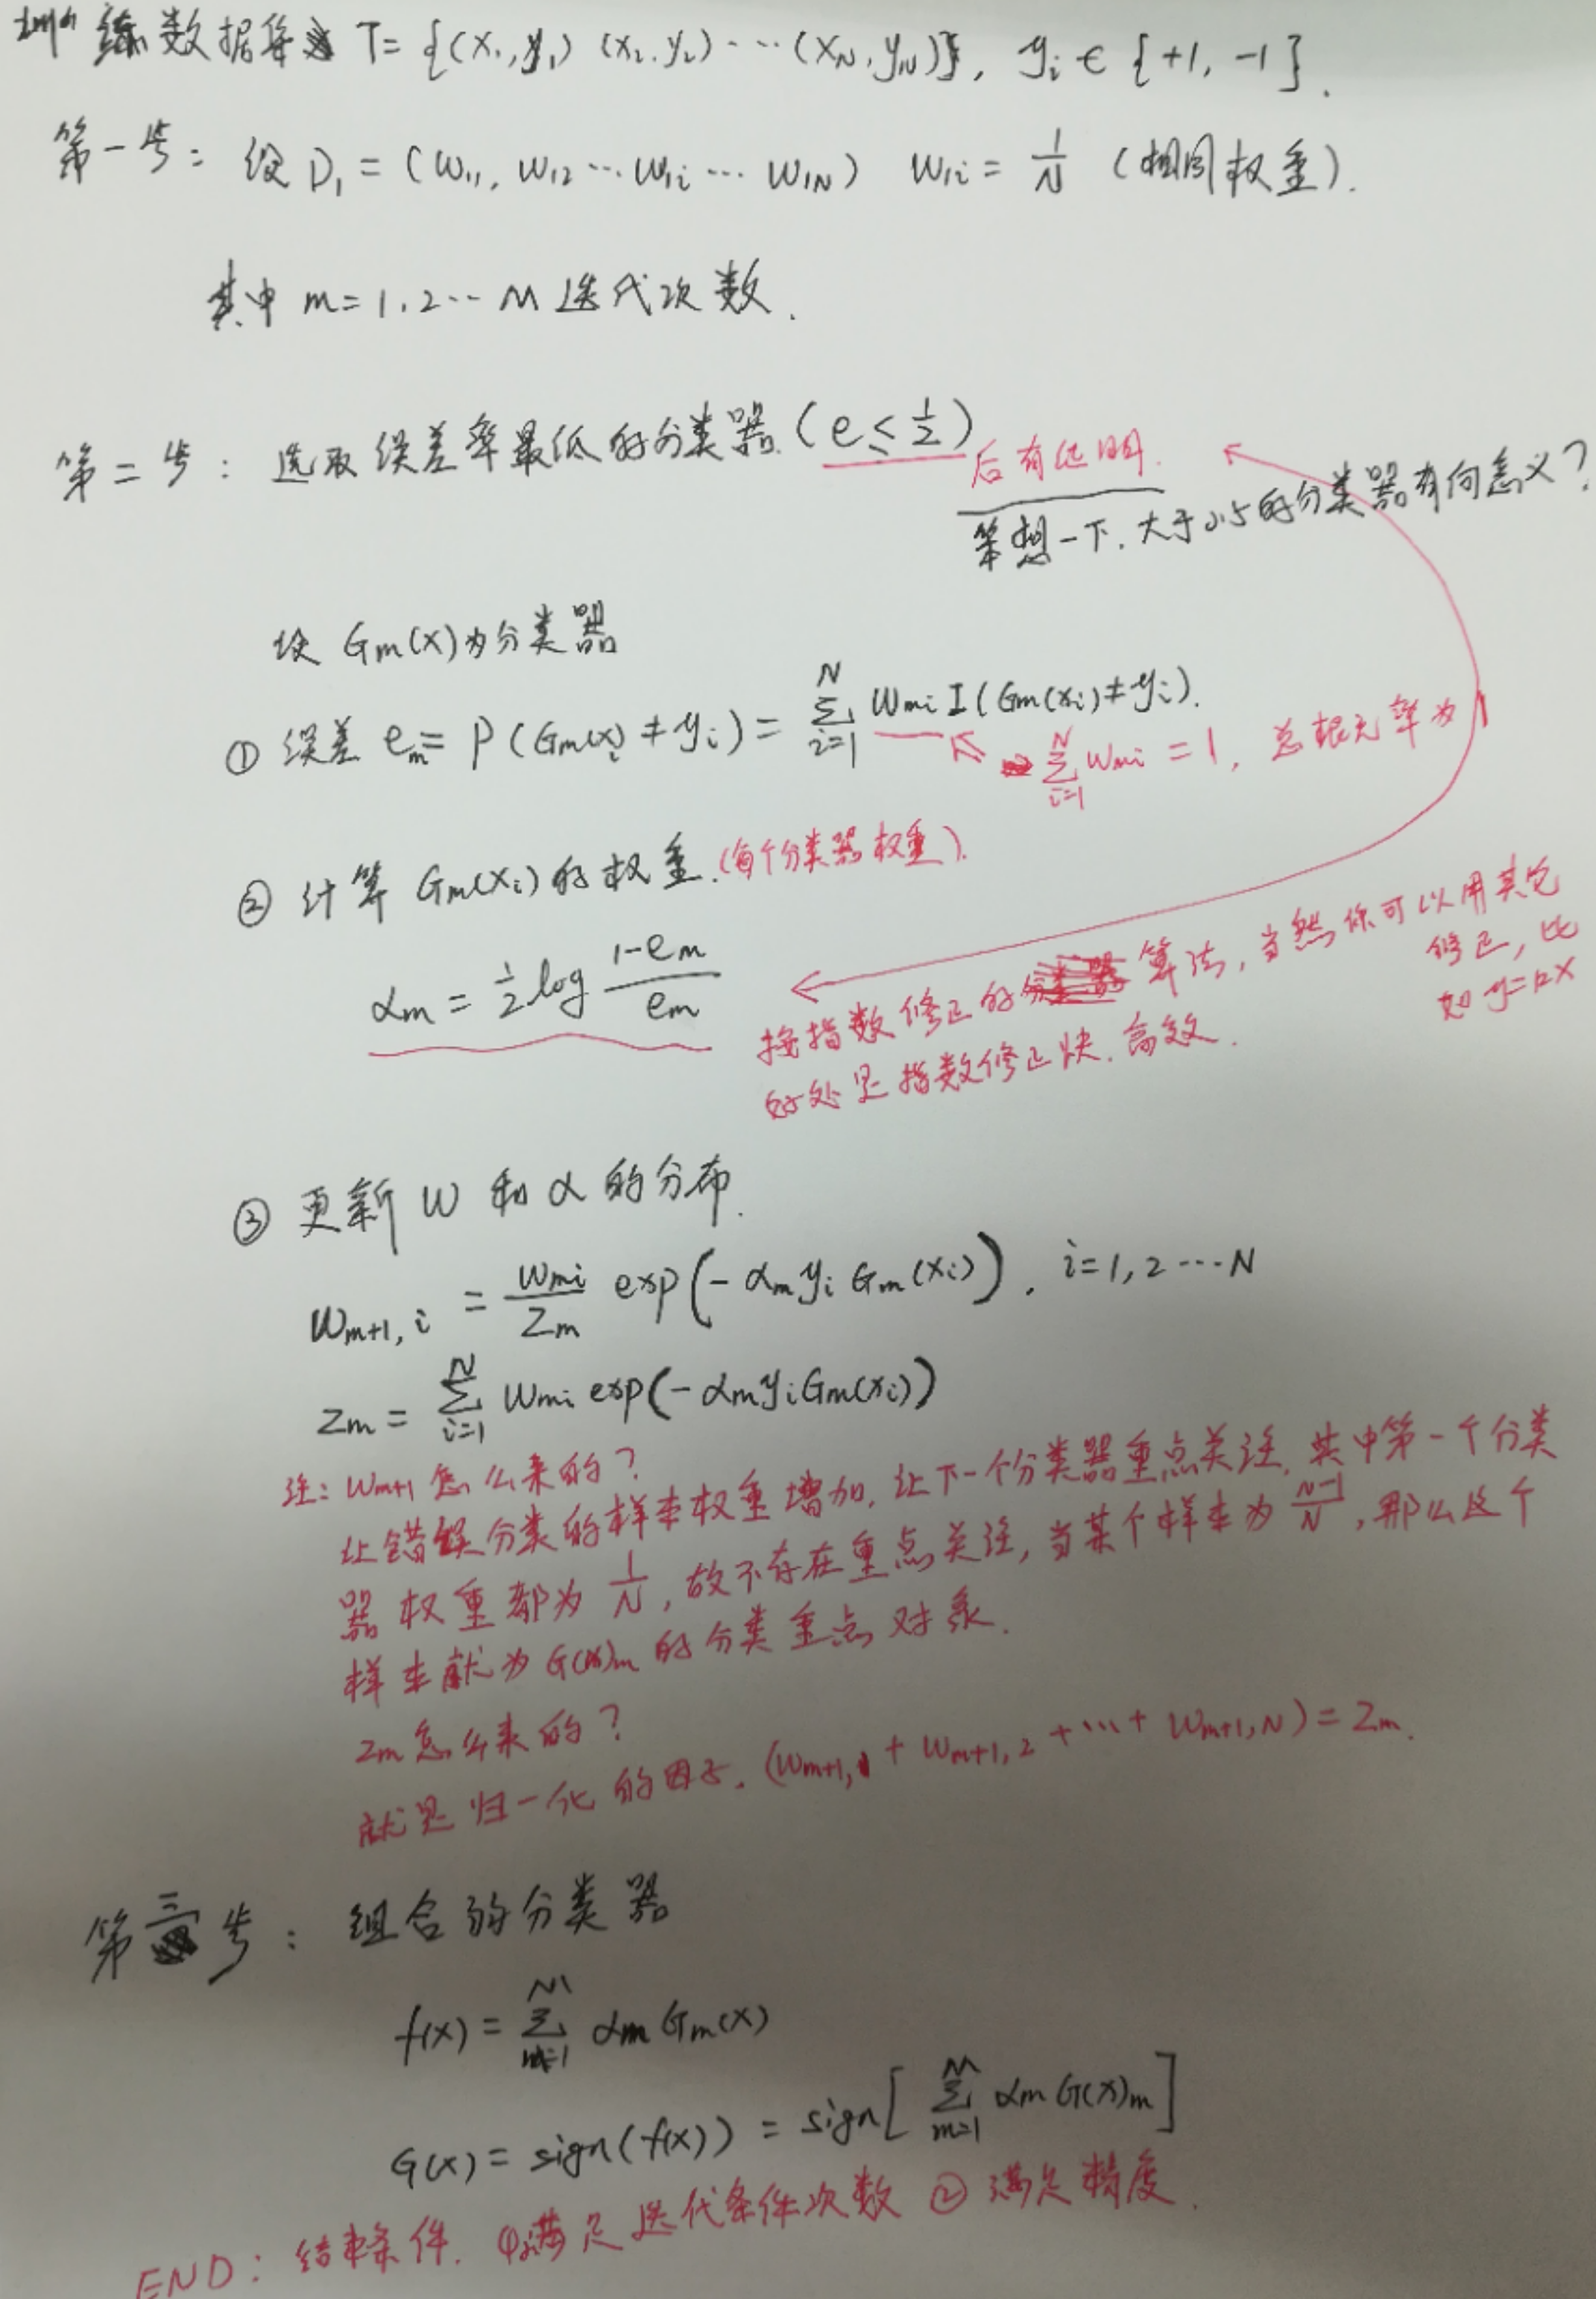
1.1 adaboost运行过程
注释:算法是利用指数函数降低误差,运行过程通过迭代进行。其中函数的算法怎么来的,你不用知道!当然你也可以尝试使用其它的函数代替指数函数,看看效果如何。
1.2 举例说明算法流程
略,花几分钟就可以看懂的例子。见:《统计学习方法》李航大大
博客都是借鉴(copy)李航博士的:http://blog.csdn.net/v_july_v/article/details/40718799 ,July算总结(copy)最好的吧!
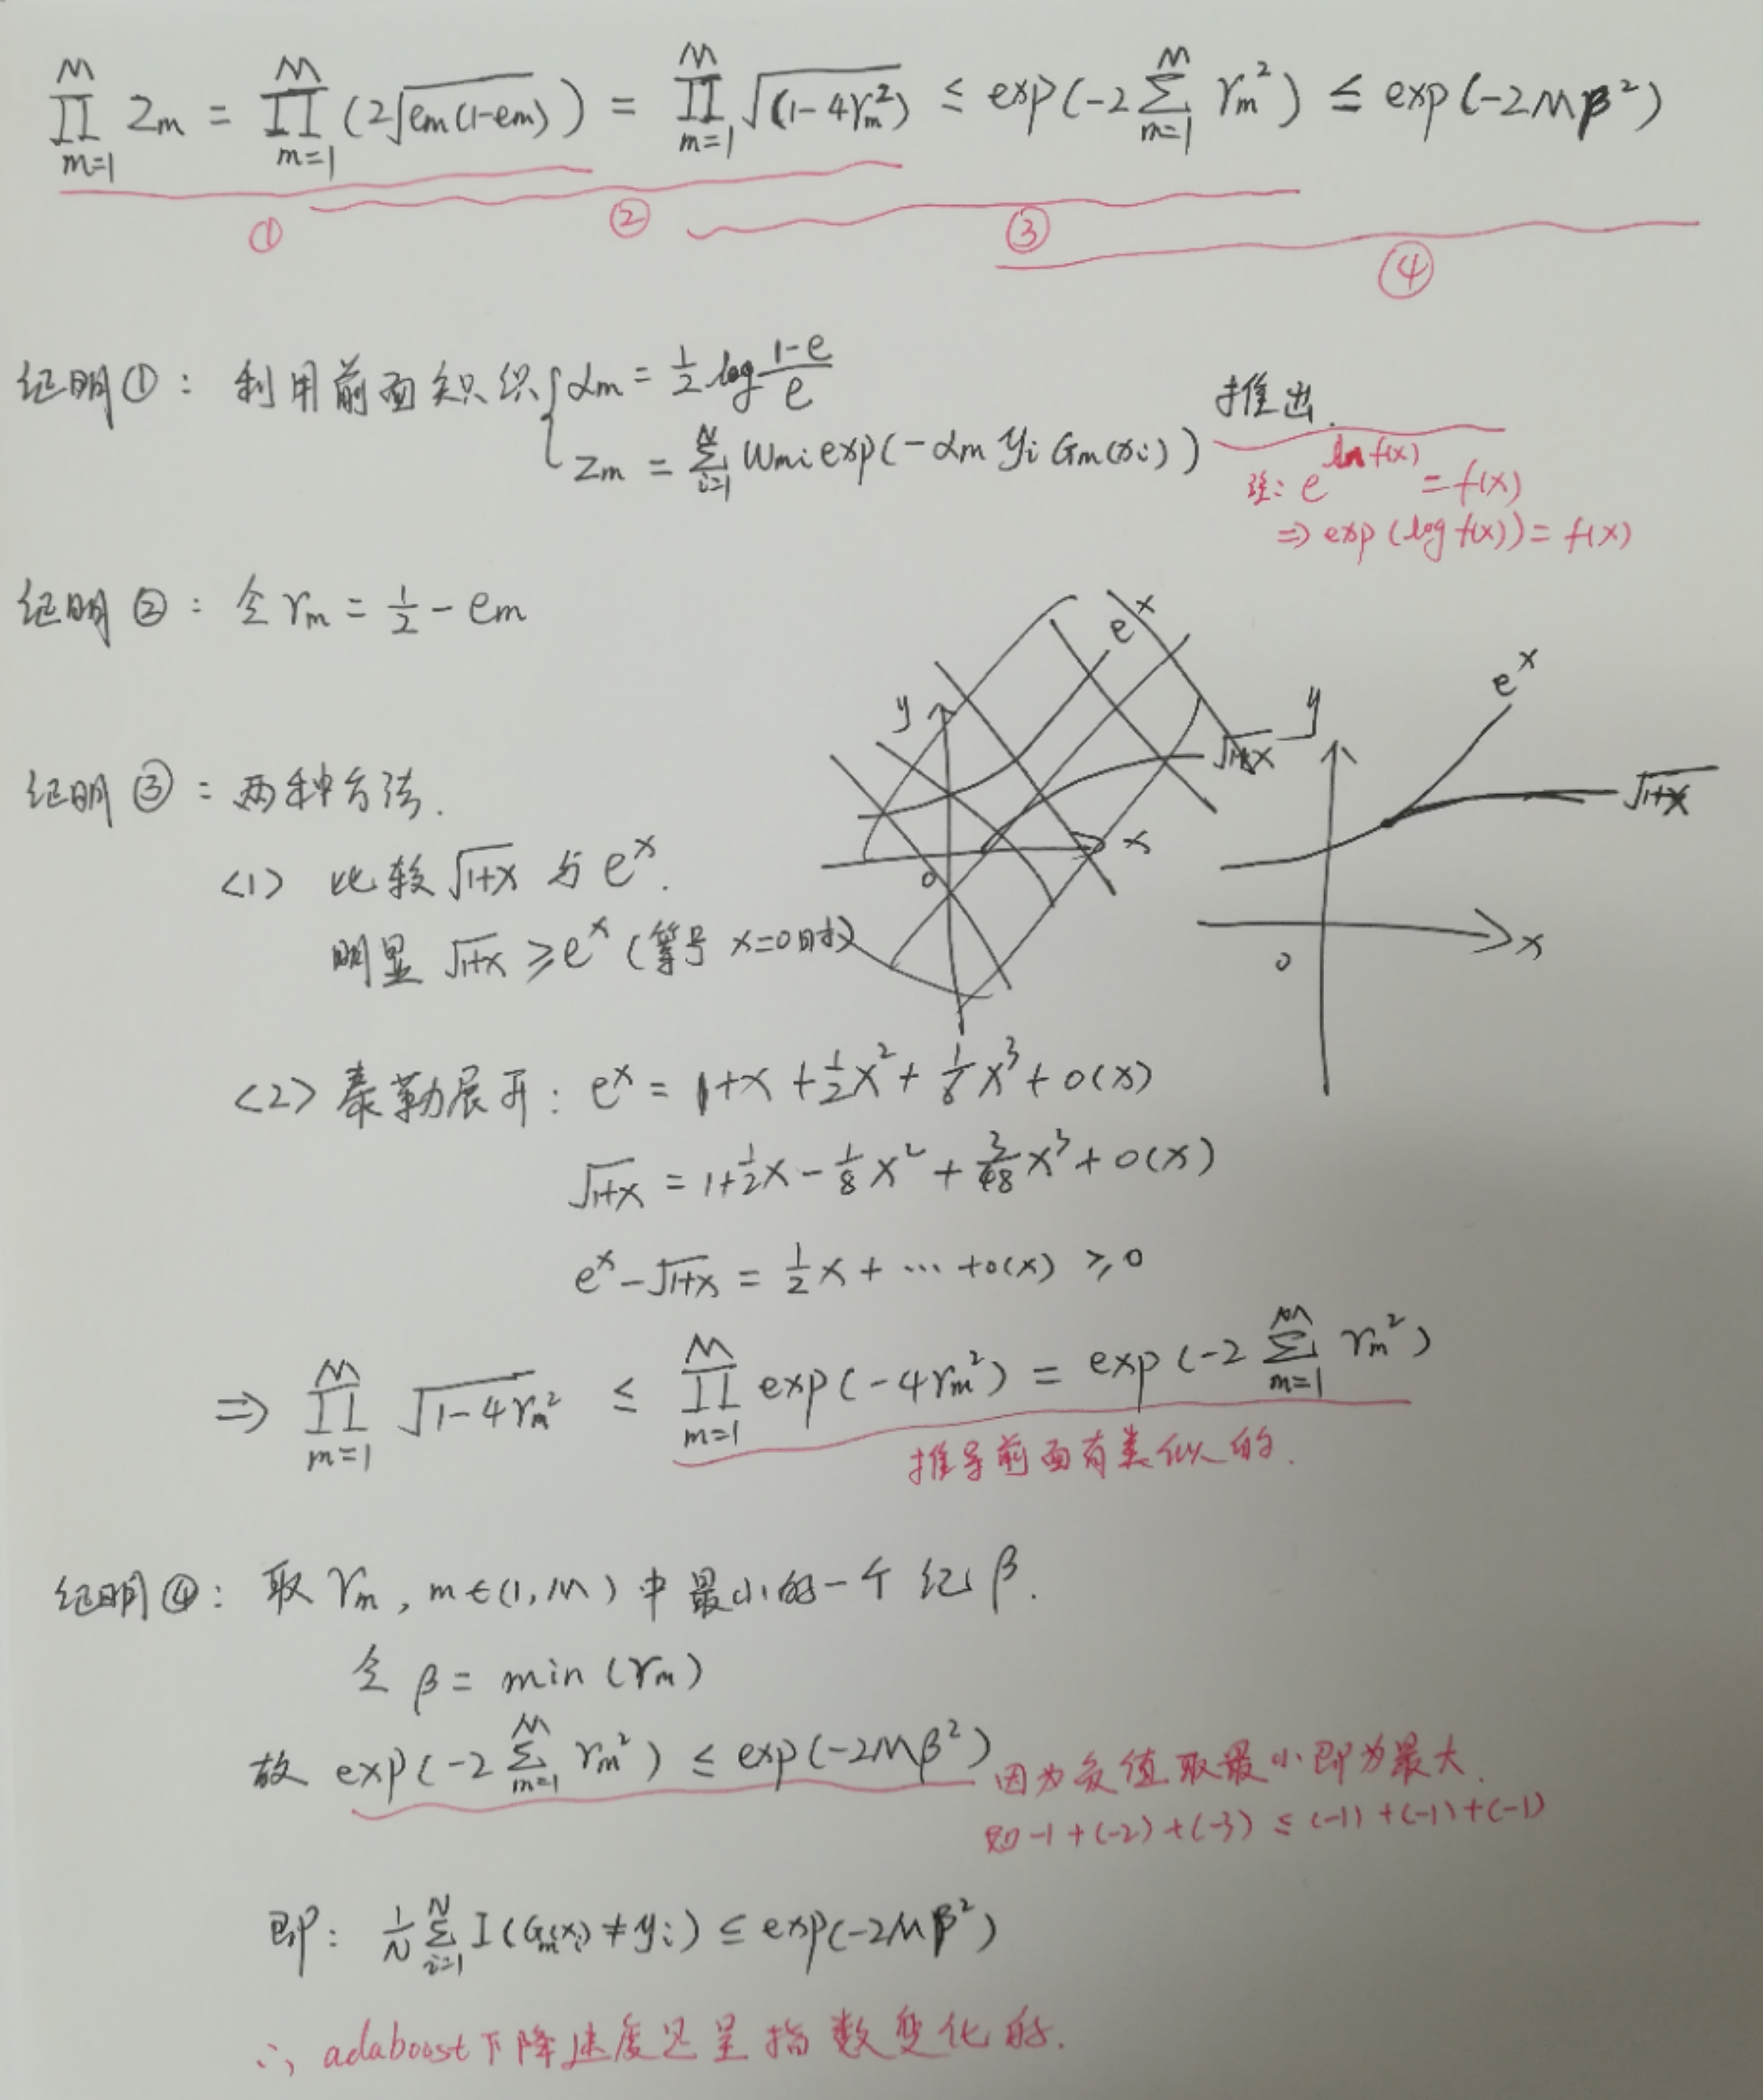
1.3 算法误差界的证明
注释:误差的上界限由Zm约束,然而Zm又是由Gm(xi)约束,所以选择适当的Gm(xi)可以加快误差的减小。
二.代码实现
注释:这里参考大神博客http://blog.csdn.net/guyuealian/article/details/70995333,举例子很详细。
2.1程序流程图
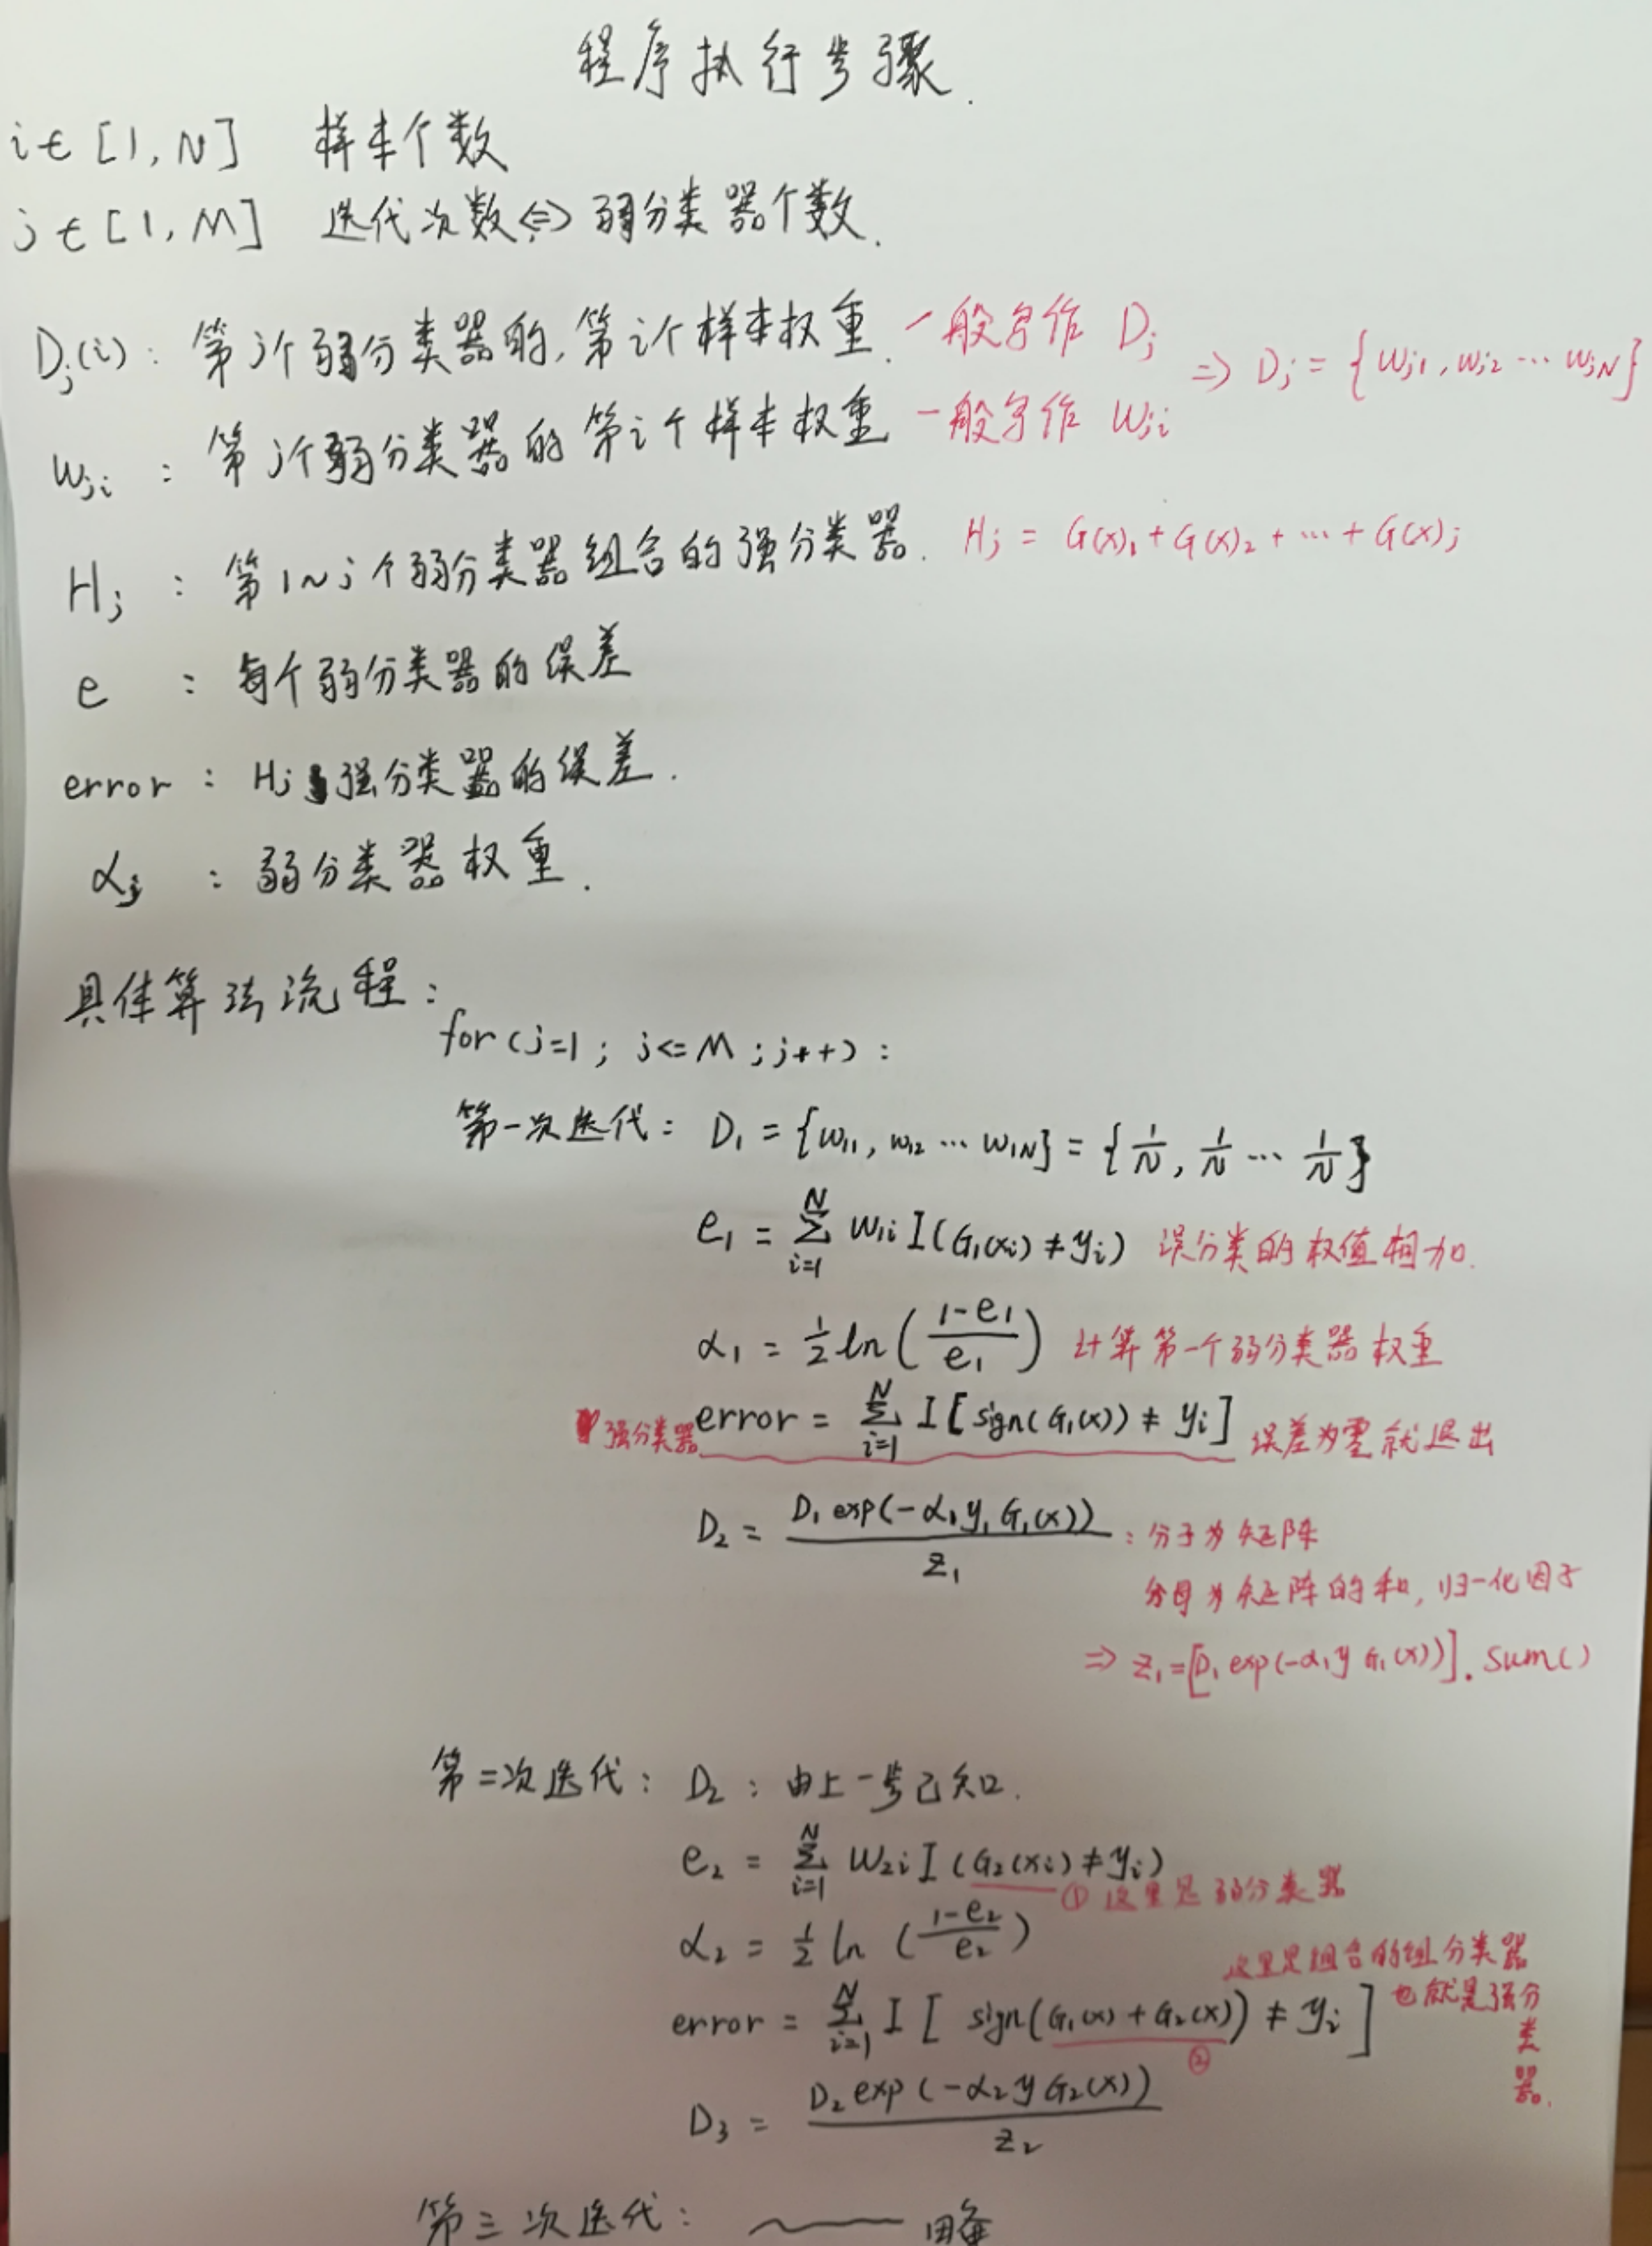
2.2基本程序实现
注释:真是倒霉玩意,本来代码全部注释好了,突然Ubuntu奔溃了,全部程序就GG了。。。下面的代码就是官网的代码,部分补上注释。现在使用Deepin桌面版了,其它方面都比Ubuntu好,但是有点点卡。
  1 from numpy import *
  2
  3 def loadDataSet(fileName):      #general function to parse tab -delimited floats
  4     numFeat = len(open(fileName).readline().split('	')) #get number of fields
  5     dataMat = []; labelMat = []
  6     fr = open(fileName)
  7     for line in fr.readlines():
  8         lineArr =[]
  9         curLine = line.strip().split('	')
 10         for i in range(numFeat-1):
 11             lineArr.append(float(curLine[i]))
 12         dataMat.append(lineArr)
 13         labelMat.append(float(curLine[-1]))
 14     return dataMat,labelMat
 15
 16 def stumpClassify(dataMatrix,dimen,threshVal,threshIneq):#just classify the data
 17     retArray = ones((shape(dataMatrix)[0],1))
 18     if threshIneq == 'lt':
 19         retArray[dataMatrix[:,dimen] <= threshVal] = -1.0
 20     else:
 21         retArray[dataMatrix[:,dimen] > threshVal] = -1.0
 22     return retArray
 23
 24
 25 def buildStump(dataArr,classLabels,D):
 26     dataMatrix = mat(dataArr); labelMat = mat(classLabels).T
 27     m,n = shape(dataMatrix)
 28     numSteps = 10.0; bestStump = {}; bestClasEst = mat(zeros((m,1)))
 29     minError = inf #init error sum, to +infinity
 30     for i in range(n):#loop over all dimensions
 31         rangeMin = dataMatrix[:,i].min(); rangeMax = dataMatrix[:,i].max();
 32         stepSize = (rangeMax-rangeMin)/numSteps
 33         for j in range(-1,int(numSteps)+1):#loop over all range in current dimension
 34             for inequal in ['lt', 'gt']: #go over less than and greater than
 35                 threshVal = (rangeMin + float(j) * stepSize)
 36                 predictedVals = stumpClassify(dataMatrix,i,threshVal,inequal)#call stump classify with i, j, lessThan
 37                 errArr = mat(ones((m,1)))
 38                 errArr[predictedVals == labelMat] = 0
 39                 weightedError = D.T*errArr  #calc total error multiplied by D
 40                 #print "split: dim %d, thresh %.2f, thresh ineqal: %s, the weighted error is %.3f" % (i, threshVal, inequal, weightedError)
 41                 if weightedError < minError:
 42                     minError = weightedError
 43                     bestClasEst = predictedVals.copy()
 44                     bestStump['dim'] = i
 45                     bestStump['thresh'] = threshVal
 46                     bestStump['ineq'] = inequal
 47     return bestStump,minError,bestClasEst
 48
 49
 50 def adaBoostTrainDS(dataArr,classLabels,numIt=40):
 51     weakClassArr = []
 52     m = shape(dataArr)[0]
 53     D = mat(ones((m,1))/m)   #init D to all equal
 54     aggClassEst = mat(zeros((m,1)))
 55     for i in range(numIt):
 56         bestStump,error,classEst = buildStump(dataArr,classLabels,D)#build Stump
 57         #print "D:",D.T
 58         alpha = float(0.5*log((1.0-error)/max(error,1e-16)))#calc alpha, throw in max(error,eps) to account for error=0
 59         bestStump['alpha'] = alpha
 60         weakClassArr.append(bestStump)                  #store Stump Params in Array
 61         #print "classEst: ",classEst.T
 62         expon = multiply(-1*alpha*mat(classLabels).T,classEst) #exponent for D calc, getting messy
 63         D = multiply(D,exp(expon))                              #Calc New D for next iteration
 64         D = D/D.sum()
 65         #calc training error of all classifiers, if this is 0 quit for loop early (use break)
 66         aggClassEst += alpha*classEst
 67         #print "aggClassEst: ",aggClassEst.T
 68         aggErrors = multiply(sign(aggClassEst) != mat(classLabels).T,ones((m,1)))
 69         errorRate = aggErrors.sum()/m
 70         print ("total error: ",errorRate)
 71         if errorRate == 0.0: break
 72     return weakClassArr,aggClassEst
 73
 74 def adaClassify(datToClass,classifierArr):
 75     dataMatrix = mat(datToClass)#do stuff similar to last aggClassEst in adaBoostTrainDS
 76     m = shape(dataMatrix)[0]
 77     aggClassEst = mat(zeros((m,1)))
 78     for i in range(len(classifierArr)):
 79         classEst = stumpClassify(dataMatrix,classifierArr[i]['dim'],
 80                                  classifierArr[i]['thresh'],
 81                                  classifierArr[i]['ineq'])#call stump classify
 82         aggClassEst += classifierArr[i]['alpha']*classEst
 83         #print aggClassEst
 84     return sign(aggClassEst)
 85
 86 def plotROC(predStrengths, classLabels):
 87     import matplotlib.pyplot as plt
 88     cur = (1.0,1.0) #cursor
 89     ySum = 0.0 #variable to calculate AUC
 90     numPosClas = sum(array(classLabels)==1.0)#标签等于1的和(也等于个数)
 91     yStep = 1/float(numPosClas); xStep = 1/float(len(classLabels)-numPosClas)
 92     sortedIndicies = predStrengths.argsort()#get sorted index, it's reverse
 93     sortData = sorted(predStrengths.tolist()[0])
 94
 95     fig = plt.figure()
 96     fig.clf()
 97     ax = plt.subplot(111)
 98     #loop through all the values, drawing a line segment at each point
 99     for index in sortedIndicies.tolist()[0]:
100         if classLabels[index] == 1.0:
101             delX = 0; delY = yStep;
102         else:
103             delX = xStep; delY = 0;
104             ySum += cur[1]
105         #draw line from cur to (cur[0]-delX,cur[1]-delY)
106         ax.plot([cur[0],cur[0]-delX],[cur[1],cur[1]-delY], c='b')
107         cur = (cur[0]-delX,cur[1]-delY)
108     ax.plot([0,1],[0,1],'b--')
109     plt.xlabel('False positive rate'); plt.ylabel('True positive rate')
110     plt.title('ROC curve for AdaBoost horse colic detection system')
111     ax.axis([0,1,0,1])
112     plt.show()
113     print ("the Area Under the Curve is: ",ySum*xStep)
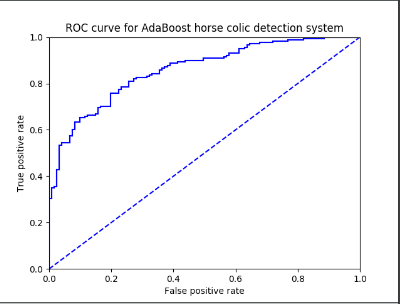
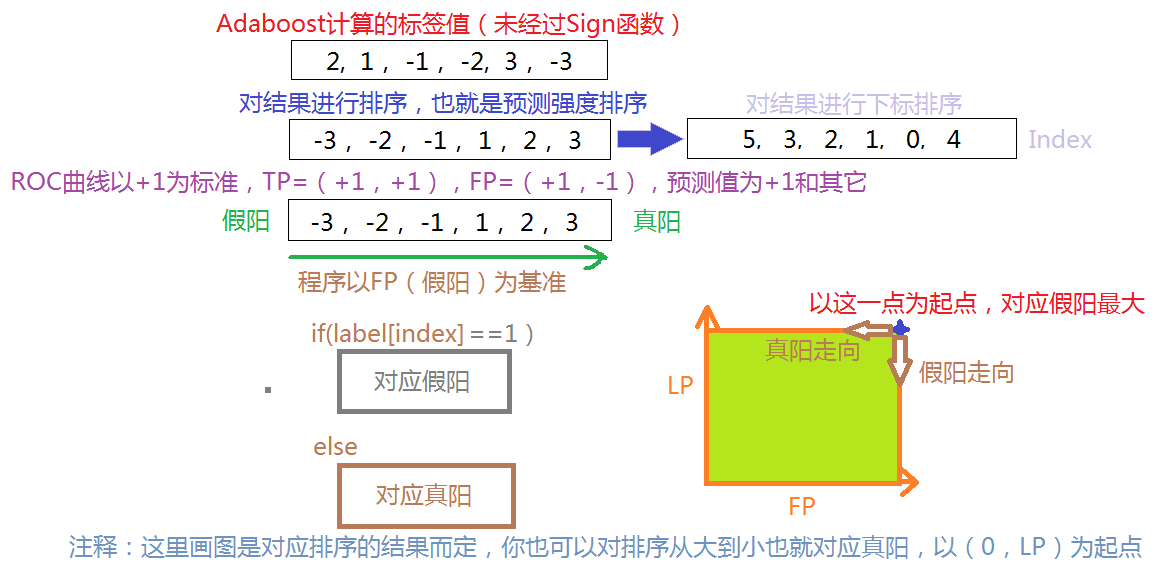
注释:重点说明一下非均衡分类的图像绘制问题,想了很久才想明白!
都是相对而言的,其中本文说的曲线在左上方就为好,也是相对而言的,看你怎么定义个理解!
参考文献:
《统计学习方法》李航
http://blog.csdn.net/v_july_v/article/details/40718799 没有书的就看这个大神的博客,基本是上面那本数的原版