行动路线轨迹绘制最近的新需求,查了本站大佬的博客,直接粘贴成功,闲的时候写个随笔记录下
原文地址:https://www.cnblogs.com/fozero/p/10867171.html
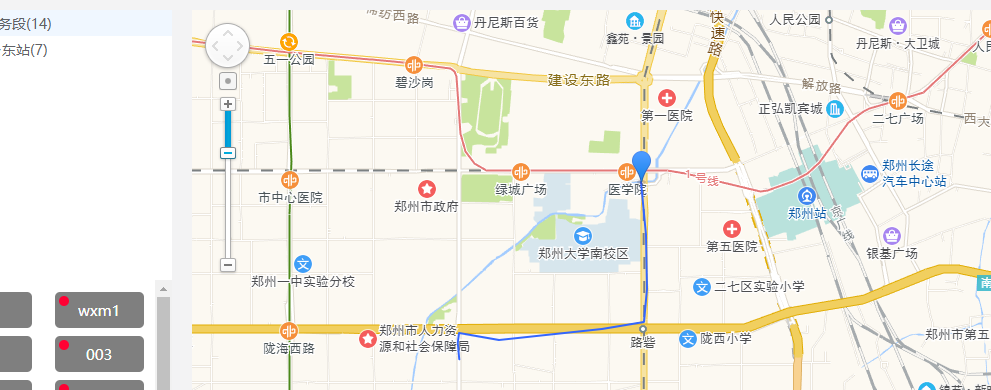
需求要求,点击003这个人显示他的行动轨迹,先看下效果图
使用
1、在index.html里面引入高德地图js文件
2、引入之后我们就直接可以在vue组件里面使用了
主要代码:
userMap:function(user,index){
            var _this = this;
            //请求按时间排序的user信息
            this.$http.post("../userLocation/getUserTrack",
                {
                    id:user.id
                },
                {emulateJSON:true}).then(function (response) {
                _this.userLocation  = response.body.data;
                if (_this.userLocation.length>0){//如果有经纬度数据就取出来放进数组中

                    var trackPath = [];
                    for(var i=0;i<_this.userLocation.length;i++){
                        trackPath.push(new AMap.LngLat(_this.userLocation[i].longitude, _this.userLocation[i].latitude))
                    }
                    //初始化地图
                    this.map = new AMap.Map('container', {
                        zoom:11,//级别
                        center: [113.668377, 34.719974],//中心点坐标
                        resizeEnable: true,
                        zoom: 12,
                    });
                    // 插件
                    AMap.plugin(['AMap.ToolBar', 'AMap.Scale'], function () {
                        _this.map.addControl(new AMap.ToolBar())
                        _this.map.addControl(new AMap.Scale())
                    })
                    // marker标记(图标)
                    this.marker = new AMap.Marker({
                        position: null
                    })
                    this.map.add(this.marker);
                    // 绘制折线
                    this.path = new AMap.Polyline({
                        path: null,
                        isOutline: false,     //线条是否带描边,默认false
                        outlineColor: '#ffeeff',//线条描边颜色,此项仅在isOutline为true时有效,默认:#000000
                        borderWeight: 1,    //描边的宽度,默认为1
                        strokeColor: "#3366FF", //线条颜色,使用16进制颜色代码赋值。默认值为#006600
                        strokeOpacity: 1,   //线条透明度,取值范围[0,1],0表示完全透明,1表示不透明。默认为0.9
                        strokeWeight: 2,    //线条宽度,单位:像素
                        // 折线样式还支持 'dashed'
                        strokeStyle: "solid",  //线样式,实线:solid,虚线:dashed
                        // strokeStyle是dashed时有效
                        strokeDasharray: [10, 5],//勾勒形状轮廓的虚线和间隙的样式,此属性在strokeStyle 为dashed 时有效
                        lineJoin: 'round',    //折线拐点的绘制样式,默认值为'miter'尖角,其他可选值:'round'圆角、'bevel'斜角
                        lineCap: 'round',   //折线两端线帽的绘制样式,默认值为'butt'无头,其他可选值:'round'圆头、'square'方头
                        zIndex: 50,       //折线覆盖物的叠加顺序。默认叠加顺序,先添加的线在底层,后添加的线在上层。通过该属性可调整叠加顺序,使级别较高的折线覆盖物在上层显示默认zIndex:50、
                    })
                    // 将第一条经纬度记录添加marker标记(图标)
                    var lastTrack = new AMap.LngLat(_this.userLocation[0].longitude,_this.userLocation[0].latitude)
                    this.map.setCenter(lastTrack)
                    this.marker.setPosition(lastTrack)
                    this.marker.show()

                    // 将折线添加至地图实例
                    this.map.add(this.path);

                    this.path.setPath(trackPath)
                    this.path.show()
                } else {
                    alert("该用户暂无行动轨迹");
                }
            });
        },