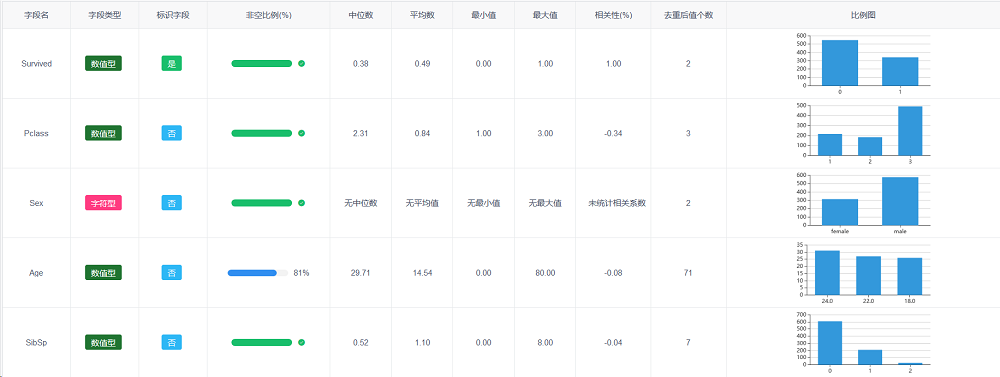
zoukankan      html  css  js  c++  java
  • IVIEW组件Table中加入EChart柱状图

    展示图如下:

    主要利用了render函数和updated()钩子函数进行数据填充与渲染。

    1、在TableColums中加入

     1 {
     2     title: '比例图',
     3     align: 'center',
     4     render: (h,
     5     params)=>{
     6         returnh('div',
     7         [
     8             h('canvas',  #在单元格内构造一个canvas用来放置图表
     9             {
    10                 style: {
    11                     height: '100px',
    12                     margin: '0',
    13                     padding: '0'
    14                 },
    15                 on: {
    16                     
    17                 },
    18                 attrs: {
    19                     id: 'lineChart'+params.index  #每个canvas都必须加上一个id标识
    20                 }
    21             })
    22         ])
    23     }
    24 }

     2、在methods中添加方法paintChart(i,params),该方法如下

     1 //绘制图表,i是当前表格数据的每一条的下标,params当前行的数据
     2 paintChart(i,params){
     3   let lineChart = Echarts.init(document.getElementById("lineChart"+i));
     4   let topField = JSON.parse(params.topField)
     5   let xAxisData = [a,b,c,d,e,f,g]
     6   let seriesData = [200,254,75,235,237,100,300]
     7    let option = {
     8     color: ['#3398DB'],
     9     tooltip : {
    10       trigger: 'axis',
    11       axisPointer : {            // 坐标轴指示器,坐标轴触发有效
    12         type : 'shadow'        // 默认为直线,可选为:'line' | 'shadow'
    13         }
    14           },
    15           grid: {
    16             left: '1%',
    17             right: '1%',
    18             bottom: '3%',
    19             top:'10%',
    20             containLabel: true
    21           },
    22           xAxis : [
    23             {
    24               type : 'category',
    25               data : xAxisData,
    26               axisTick: {
    27                 alignWithLabel: true
    28               }
    29             }
    30           ],
    31           yAxis : [
    32             {
    33               type : 'value'
    34             }
    35           ],
    36           series : [
    37             {
    38               name:'直接访问',
    39               type:'bar',
    40               barWidth: '60%',
    41               data:seriesData
    42             }
    43           ]
    44   }
    45   lineChart.setOption(option)
    46 }

     3、在钩子函数updated()中调用paintChart(i,params)方法进行渲染

    1 updated(){
    2       let self = this
    3       self.tableData.forEach((value,index)=>{
    4         this.paintChart(index,value)
    5       })
    6  }
  • 相关阅读:
    POJ 1681 Painter's Problem(高斯消元法)
    HDU 3530 Subsequence(单调队列)
    HDU 4302 Holedox Eating(优先队列或者线段树)
    POJ 2947 Widget Factory(高斯消元法,解模线性方程组)
    HDU 3635 Dragon Balls(并查集)
    HDU 4301 Divide Chocolate(找规律,DP)
    POJ 1753 Flip Game(高斯消元)
    POJ 3185 The Water Bowls(高斯消元)
    克琳:http://liyu.eu5.org
    WinDbg使用
  • 原文地址:https://www.cnblogs.com/wlovet/p/10820232.html
Copyright © 2011-2022 走看看