zoukankan      html  css  js  c++  java
  • 关于echarts地图下钻。

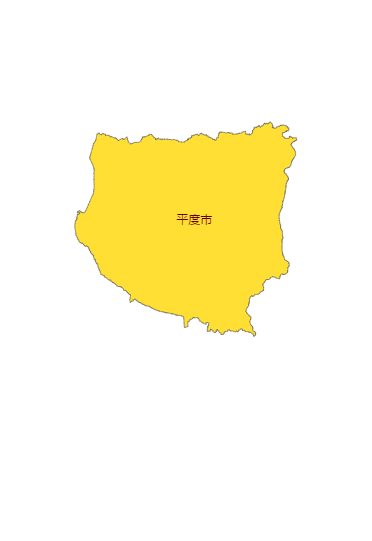
        在去年十二月份,前端老大交代个任务,关于地图下钻。这里做了个简单的青岛地图下钻,初学echarts,做的不精,凑合看看吧。

       第一步呢,先引入echarts等文件,这是最基本的。


        第二步,到官网下载青岛各区的json包,网址 http://ecomfe.github.io/echarts-map-tool/ (建议:在做地图下钻时,最好用json包,不用js文件)

            第三步,页面新建区域。

        <div id="main" style="height: 90%"></div>

        第四步,js文件内容,看代码。


    var chart = echarts.init(document.getElementById('main'));
             var cityProper = {
                 '城阳区': 'js/chengyang.json',
                 '崂山区': 'js/laoshan.json',
                 '李沧区': 'js/licang.json',
                 '市北区': 'js/shibei.json',
                 '市南区': 'js/shinan.json',
                 '黄岛区': 'js/huangdao.json',
                 '胶州市': 'js/jiaozhou.json',
                 '即墨市': 'js/jimo.json',
                 '莱西市': 'js/laixi.json',
                 '平度市': 'js/pingdu.json'
             };
             var data = [{
                 name: '城阳区'
             }, {
                 name: '崂山区'
             }, {
                 name: '李沧区'
             }, {
                 name: '市北区'
             }, {
                 name: '市南区'
             }, {
                 name: '黄岛区'
             }, {
                 name: '胶州市'
             }, {
                 name: '即墨市'
             }, {
                 name: '莱西市'
             }, {
                 name: '平度市'
             }];
    
             //获取青岛地图数据。
             $.get('js/qingdao.json', function(getJSON) { 
                 echarts.registerMap("青岛",getJSON)
                     option = {
                         grid: {
                            left: '5%',
                            right: '4%',
                            top:'0%',
                            bottom: '0%',
                            '100%',
                            containLabel: true
                        },
                        toolbox: {
                             show: true,
                             orient: 'vertical',
                             x: 'right',
                             y: 'center',
                             feature: {
                                 mark: {
                                     show: true
                                 },
                                 dataView: {
                                     show: true,
                                     readOnly: false
                                 }
                             }
                         },
                         series: [{
                             tooltip: {
                                 trigger: 'item'
                             },
                             name: '选择器',
                             type: 'map',
                             mapType: '青岛',
                             left: '20%',
                             top: '20%',
                            
                             roam: true,
                             selectedMode: 'single',
                             itemStyle: {
                                 normal: {
                                     label: {
                                         show: true
                                     }
                                 },
                                 emphasis: {
                                     label: {
                                         show: true
                                     }
                                 }
                             },
                             data: data
                         }],
                         animation: false
                     };
    
    
                     chart.setOption(option, false);
                     
                     chart.on("click", chartClick);
                })
                
             function chartClick(param){ 
                chart.setOption(option, false); 
    
                var selectedPro = param.name;
                if (!cityProper[selectedPro]) {
                     option.series.splice(1);
                     option.legend = null;
                     option.visualMap = null;
                     chart.setOption(option, true);
                     return;
                 }
                
                //获取点击区域数据
                 $.get(cityProper[selectedPro], function(geojson) {
                     echarts.registerMap(selectedPro, geojson);
                     //根据需求,如果要替换青岛地图,series参数为[0],不替换为[1],其中left、top自己设置。
                     option.series[0] = {
                         name: '选择器',
                         type: 'map',
                         mapType: selectedPro,
                         left: '20%',
                         top: '20%',
                          '18%',
                         roam: true,
                         selectedMode: 'single',
                         itemStyle: {
                             normal: {
                                 label: {
                                     show: true
                                 }
                             },
                             emphasis: {
                                 label: {
                                     show: true
                                 }
                             }
                         },
                         data: data
                     };
                    
                     chart.setOption(option, true);
                 })
    
             };

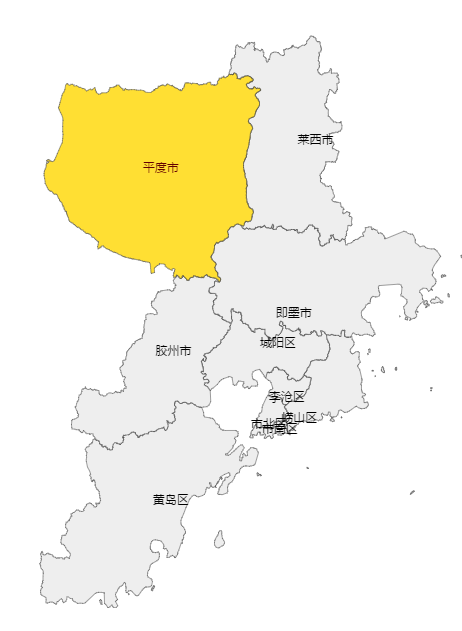
    效果图:
        第一篇文章,写的不好,莫怪,莫怪。。。。。

  • 相关阅读:
    Codeforces 845E Fire in the City 线段树
    Codeforces 542D Superhero's Job dp (看题解)
    Codeforces 797F Mice and Holes dp
    Codeforces 408D Parcels dp (看题解)
    Codeforces 464D World of Darkraft
    Codeforces 215E Periodical Numbers 容斥原理
    Codeforces 285E Positions in Permutations dp + 容斥原理
    Codeforces 875E Delivery Club dp
    Codeforces 888F Connecting Vertices 区间dp (看题解)
    Codeforces 946F Fibonacci String Subsequences dp (看题解)
  • 原文地址:https://www.cnblogs.com/wlpower/p/6369480.html
Copyright © 2011-2022 走看看