1. 可重复研究 和 可再生研究(Replication vs. Reproducible Research)
1.1 Replication(可重复)
- 独立的研究者 / 数据 / 分析方法 / 工具得到一致的证据
· 小保方晴子
· 具身认知(embodied cognition)
- 缺点:
· 有些研究不可能被重复:没钱 / 没时间 / 没机会 / 独特性
1.2 Reproducible Research(可再现研究)
- 让数据和分析过程(code)透明
- 使用你的数据和分析方法得到你的结果
2. R Markdown
- Reproducible Research 的工具
- 人可以读懂的语言:文字(目的 / 方法)
- 机器可以读懂的语言:code(夹在数据 / 计算结果 / 生成图和表)
- R Markdown:R code + Markdown
- R Markdown => Markdown => HTML
- Markdown 语法:
1. 斜体
* two stars *
2. 粗体
** four stars **
3. 标题
## This is a secondary heading
### This is a tertiary heading
4. 无序列表
- first item
- second item
5. 有序列表
1. first item
2. second item
6. 链接
[imooc](http://www.imooc.com)
7. 新行 / 换行
在上一行结尾添加两个空格
8. 更多请参见:
http://daringfireball.net/projects/markdown/basics
http://help.github.com/articles/working-with-advanced-formatting/
- 实例:
1. 软件自带案例
---
title: "test"
author: "Wayne"
date: "2017年2月25日"
output: html_document
---
```{r setup, include=FALSE}
knitr::opts_chunk$set(echo = TRUE)
```
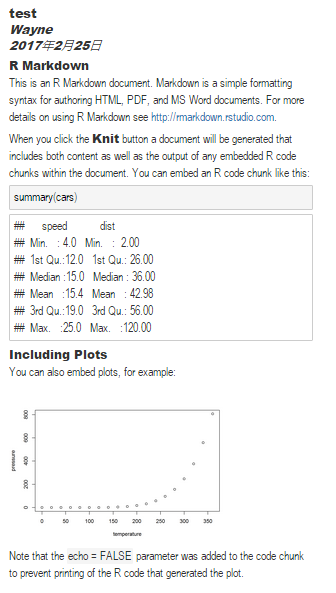
## R Markdown
This is an R Markdown document. Markdown is a simple formatting syntax for authoring HTML, PDF, and MS Word documents. For more details on using R Markdown see <http://rmarkdown.rstudio.com>.
When you click the **Knit** button a document will be generated that includes both content as well as the output of any embedded R code chunks within the document. You can embed an R code chunk like this:
```{r cars}
summary(cars)
```
## Including Plots
You can also embed plots, for example:
```{r pressure, echo=FALSE}
plot(pressure)
```
Note that the `echo = FALSE` parameter was added to the code chunk to prevent printing of the R code that generated the plot.
2. 一个简单案例
---
title: "Welcome to R Visualization"
author: "Wayne"
date: "2017年2月25日"
output: html_document
---

```{r setup, include=FALSE}
knitr::opts_chunk$set(echo = TRUE)
```

## R Visualization

## Base Plotting System
- plot
- prictice

## Lattice Plotting System

## ggplot2 Plotting System
1. qplot
2. ggplot

Welcome to [imooc](http://www.imooc.com)
