Python实现PLA(感知机)
运行环境
- Pyhton3
- numpy(科学计算包)
- matplotlib(画图所需,不画图可不必)
计算过程
st=>start: 开始
e=>end
op1=>operation: 读入数据
op2=>operation: 格式化数据
cond=>condition: 权重是否不变
op3=>operation: 更新权重
op4=>operation: 输出结果

st->op1->op2->cond
cond(yes)->op4->e
cond(no)->op3->cond
输入样例
/* Dataset.txt */
训练集:

    vector(第一项是截距项)        label
    ------------------------------------------
    [1, 1, 4]                     1
    [1, 2, 3]                     1
    [1, -2, 3]                    1
    [1, -2, 2]                    0
    [1, 0, 1]                     0
    [1, 1, 2]                     0

测试集:

    vector(第一项是截距项)        label
    ------------------------------------------
    [1, 1, 1]                     ?
    [1, 2, 0]                     ?
    [1, 2, 4]                     ?
    [1, 1, 3]                     ?
代码实现
# -*- coding: utf-8 -*-
__author__ = 'Wsine'
from numpy import *
import matplotlib.pyplot as plt
import operator
import time
LINE_OF_DATA = 6
LINE_OF_TEST = 4
def createTrainDataSet():
trainDataMat = [[1, 1, 4],
[1, 2, 3],
[1, -2, 3],
[1, -2, 2],
[1, 0, 1],
[1, 1, 2]]
trainShares = [1, 1, 1, -1, -1, -1]
return trainDataMat, trainShares
def createTestDataSet():
testDataMat = [[1, 1, 1],
[1, 2, 0],
[1, 2, 4],
[1, 1, 3]]
return testDataMat
def autoNorm(dataSet):
minVals = dataSet.min(0)
maxVals = dataSet.max(0)
ranges = maxVals - minVals
normDataSet = zeros(shape(dataSet))
m = dataSet.shape[0]
normDataSet = dataSet - tile(minVals, (m, 1))
normDataSet = normDataSet / tile(ranges, (m, 1))
return normDataSet[:LINE_OF_DATA], normDataSet[LINE_OF_DATA:]
def sigmoid(inX):
inX = float(inX)
if inX > 0:
return 1
elif inX < 0:
return -1
else:
return 0
def pla(dataMatIn, classLabels):
dataMatrix = mat(dataMatIn)
labelMat = mat(classLabels).transpose()
m, n = shape(dataMatrix)
weights = ones((n, 1))
while True:
isCompleted = True
for i in range(m):
if (sigmoid(dot(dataMatrix[i], weights)) == labelMat[i]):
continue
else:
isCompleted = False
weights += (labelMat[i] * dataMatrix[i]).transpose()
if isCompleted:
break
return weights
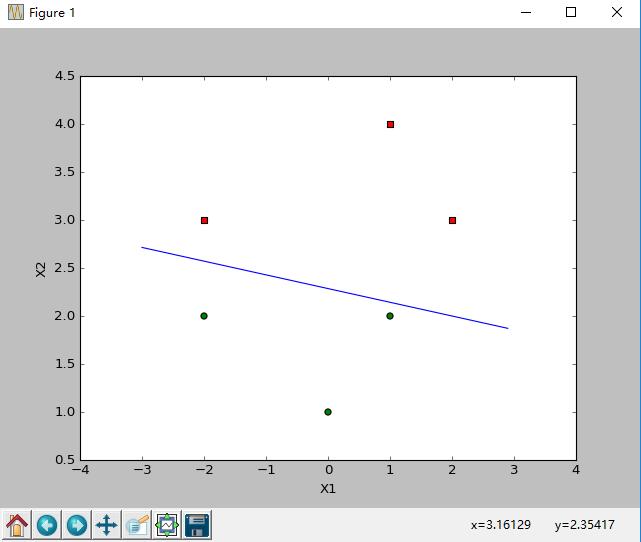
def plotBestFit(weights):
dataMat, labelMat = createTrainDataSet()
dataArr = array(dataMat)
n = shape(dataArr)[0]
xcord1 = []; ycord1 = []
xcord2 = []; ycord2 = []
for i in range(n):
if int(labelMat[i]) == 1:
xcord1.append(dataArr[i, 1])
ycord1.append(dataArr[i, 2])
else:
xcord2.append(dataArr[i, 1])
ycord2.append(dataArr[i, 2])
fig = plt.figure()
ax = fig.add_subplot(111)
ax.scatter(xcord1, ycord1, s=30, c='red', marker='s')
ax.scatter(xcord2, ycord2, s=30, c='green')
x = arange(-3.0, 3.0, 0.1)
y = (-weights[0] - weights[1] * x) / weights[2]
ax.plot(x, y)
plt.xlabel('X1'); plt.ylabel('X2')
plt.show()
def classifyVector(inX, weights):
prob = sigmoid(sum(inX * weights))
if prob > 0:
return 1
else:
return 0
def classifyAll(dataSet, weights):
predict = []
for vector in dataSet:
predict.append(classifyVector(vector, weights))
return predict
def main():
trainDataSet, trainShares = createTrainDataSet()
testDataSet = createTestDataSet()
#trainDataSet, testDataSet = autoNorm(vstack((mat(trainDataSet), mat(testDataSet))))
regMatrix = pla(trainDataSet, trainShares)
print("regMatrix =
", regMatrix)
plotBestFit(regMatrix)
predictShares = classifyAll(testDataSet, regMatrix)
print("predictResult:
", predictShares)
if __name__ == '__main__':
start = time.clock()
main()
end = time.clock()
print('finish all in %s' % str(end - start))
输出样例
regMatrix =
 [[-16.]
 [  1.]
 [  7.]]
predictResult:
 [0, 0, 0, 0]
finish all in 1.213873749436057