一、背景
目前我们的生产环境一层Nginx已经容器化部署,但是监控并不完善,我们期望其具有Ingress-Nginx-Controller组件上报监控的数据。这样可以建立请求全链路的监控大盘。有利于监控查看关键链路的状态信息,并快速定位问题。因此需要研究Ingress-Nginx-Controller组件的监控机制原理,看是否可以移植到一层nginx上实现metrics监控数据的采集。
二、分析
首先,目前常用的Ingress-Nginx-Controller有两个。一个是K8S官方开源的Ingress-Nginx-Controller,另一个是nginx官方开源的Ingress-Nginx-Controller。我们使用的是K8S官方的版本。
这两个Controller大致的区别如下:
1)K8S官方的Controller也是采用Go语言开发的,集成了Lua实现的OpenResty;而Nginx官方的Ccontroller是集成了Nginx;
2)两者对Nginx的配置不同,并且使用的nginx.conf配置模板也是不一样的,Nginx官方的采用两个模板文件以include的方式配置upstream;K8S官方版本采用Lua动态配置upstream,所以不需要reload。
所以,在pod频繁变更的场景下,采用K8S官方版本不需要reload,影响会更小。
接下来,我们来看K8S官方的Ingress-Nginx-Controller是如何实现Metrics监控数据采集上报的。
根据Ingress-Nginx-Controlleroller内部架构图:
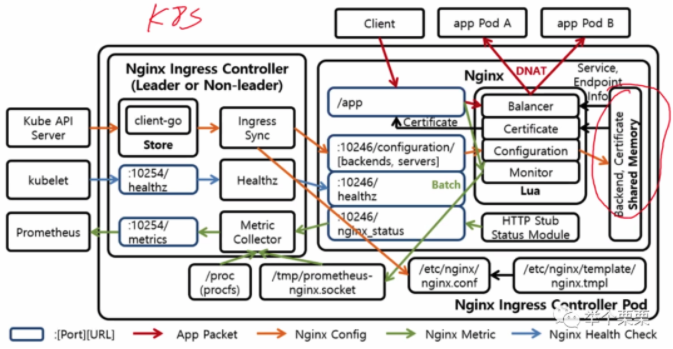
可以知道,Ingress-Nginx-Controller的内部组成部分和通讯机制。这里我们针对Nginx Metrics部分展开分析。于是,我们分析一下Ingress-Nginx-Controller的源码,找到其Metrics的入口。
在ingress-nginx/cmd/nginx/main.go文件中,我们找到了Metrics的入口,如下:
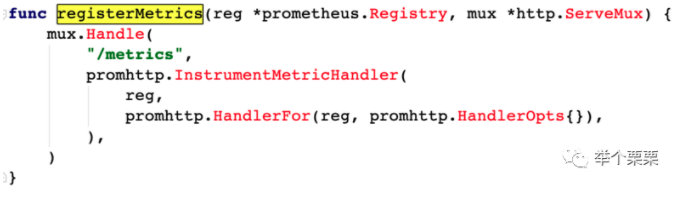
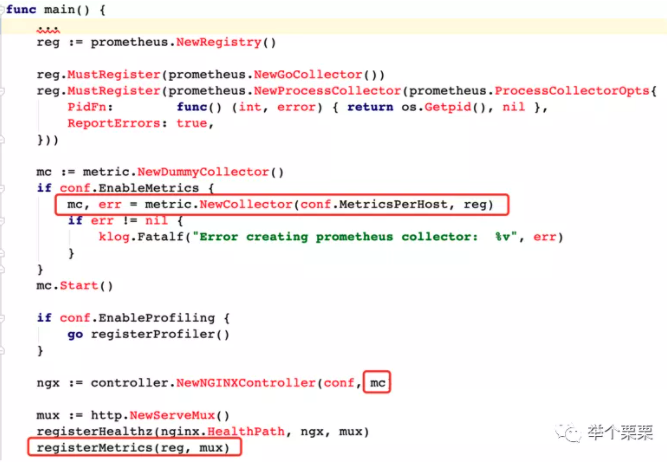
可以看到,当我们访问/metrics路径去获取监控数据时,程序会返回metrics.NewCollector()中采集的数据。继续分析metrics.NewCollector的逻辑。在ingress-nginx/internal/ingress/metrics/main.go文件中,我们可以看到:

这就是metrics真实数据来源的采集入口,我们可以看到一共包含了四部分的数据:NGINXStatus,NGINXProcess,SocketCollector和IngressController。下面,我们看下这四部分数据具体是什么?
1)NGINXStatus

其中nginx.StatusPath就是/nginx_status
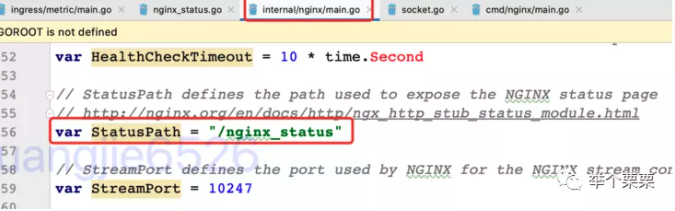
由此可知,NGINXStatus的数据就是通过/nginx_status有nginx的status模板采集的数据。
2)NGINXProcess
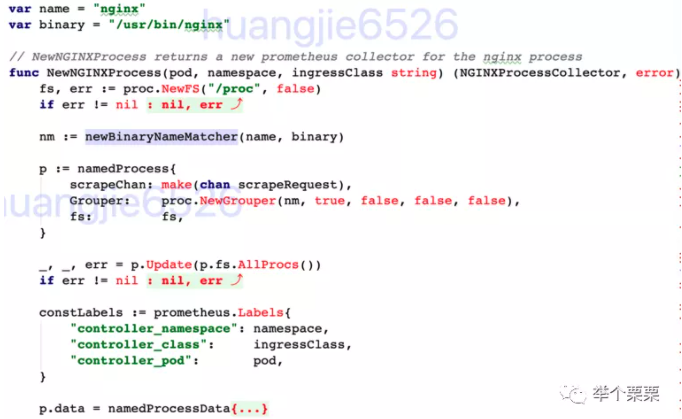
而NGINXProcess的数据则是通过process_exporter的方式在/proc中采集nginx相关的数据。
3)SocketCollector
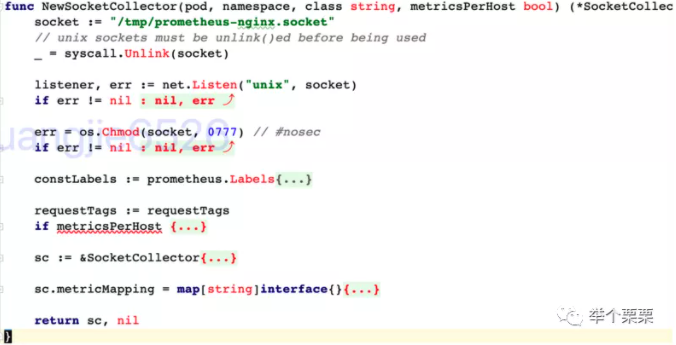
而NGINXSocket部分的数据则是监听/tmp/prometheus-nginx.socket这个socket文件来收集的数据。那么这个文件的数据来源是哪里呢?我们grep一下这个文件,发现nginx的lua脚本中有一个monitor.lua文件,就是这个文件采集到nginx的数据后写进去的。

由此可知,NGINXSocket的数据是通过monitor.lua采集的。
4)IngressController
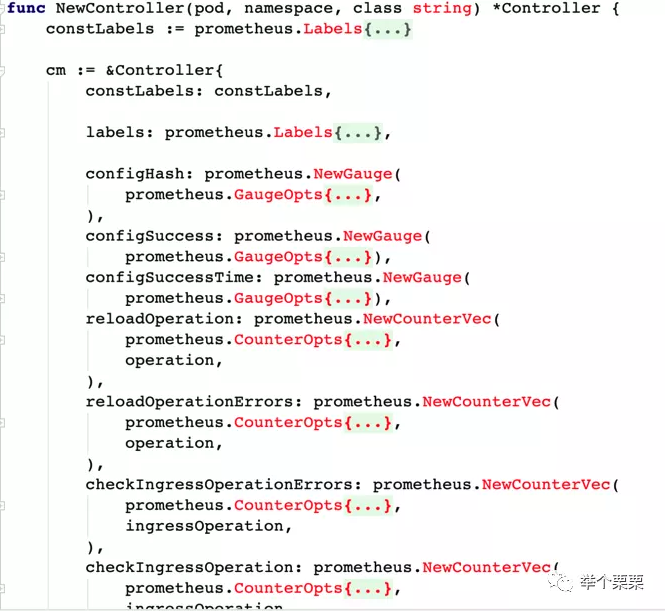
而NGINXController部分的数据则controller对nginx操作状态信息的统计,然后直接上报的。
经过以上的分析,我们知道。ingress-nginx-controller的metrics监控包含了四部分数据:NGINXStatus,NGINXProcess,SocketCollector和IngressController。
其中NGINXStatus和SocketCollector都是在nginx中实现,通过nginx自身的status模板和monitor.lua实现,并通过http或者socket的方式暴露。NGINXProcess和IngressController则是有ingress-controller本身实现。
三、一层Nginx实现类似ingress-nginx-controller的metrics监控
由上面的分析我们可以知道,要使得普通的nginx实例具备Ingress-Nginx-Controller的metrics监控能力,需要将NGINXStatus,NGINXProcess,SocketCollector和IngressController四部分的数据采集能力移植到nginx实例上。
1)NGINXStatus不需要移植,nginx开启status模块,以/nginx_status暴露即可;
2)SocketCollector移植简单,将monitor.lua脚本拷贝到nginx中,简单配置跑起来即可;该部分是SocketCollector监听在/tmp/prometheus-nginx.socket文件,由monitor.lua采集数据后写入。
3)NGINXProcess和IngressController移植较复杂,需要深入分析其源码,从ingress-nginx-controller中剥离出来后单独运行。其中IngressController部分的数据丢弃。
最后,通过抽离移植NGINXStatus,NGINXProcess,SocketCollector三部分监控内容。(代码见:https://github.com/wsjhk/nginx-custom-metrics.git)部署到一层nginx中需要做如下变更:
1)抽离出来的代码编译为ngxcustom-metrics二进制可执行文件,打包到nginx的镜像中,随容器启动一起启动。
2)nginx的配置中需要添加Lua相关代码的部署,具体配置参考源码。
3)Prometheus配置采集一层nginx的metrics监控信息。验证监控数据。
(一层Nginx的容器化实现参考:https://mp.weixin.qq.com/s/q_kTlflDMg6MGyNOq6sVjQ)
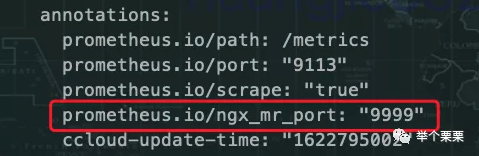
3.1)deployment中添加annotation:
3.2)添加job_name采集:
- job_name: 'slb-nginx-pods'
  honor_labels: false
  kubernetes_sd_configs:
  - role: pod
    namespaces:
      names:
      - slb-nginx
  tls_config:
    insecure_skip_verify: true
  relabel_configs:
  - target_label: dc
    replacement: huadong1
  - target_label: cloud
    replacement: aliyun
  - source_labels: [__meta_kubernetes_namespace]
    action: replace
    target_label: namespace
  - source_labels: [__meta_kubernetes_pod_name]
    action: replace
    target_label: pod
  - source_labels: [__meta_kubernetes_pod_annotation_prometheus_io_scrape]
    action: keep
    regex: true
  - source_labels: [__meta_kubernetes_pod_annotation_prometheus_io_path]
    action: replace
    target_label: __metrics_path__
    regex: (.+)
  - source_labels: [__address__, __meta_kubernetes_pod_annotation_prometheus_io_ngx_mr_port]
    action: replace
    regex: ([^:]+)(?::d+)?;(d+)
    replacement: $1:$2
    target_label: __address__
  - source_labels: [__meta_kubernetes_pod_annotation_prometheus_io_scheme]
    action: replace
    target_label: __scheme__
    regex: (.+)
采集到的数据样例如下:
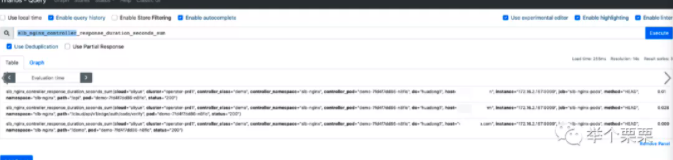
至此,完成了Nginx监控Metrics的改造。