一:需求及基础:
场景:
1、开发人员不能登录线上服务器查看详细日志
2、各个系统都有日志,日志数据分散难以查找
3、日志数据量大,查询速度慢,或者数据不够实时
4、一个调用会涉及到多个系统,难以在这些协调中快速定位数据
Elastic Search + LogStash + Kibana = ELK Stack
logstash1----| (redis实现松耦合功能)
logstash2----|----->broker redis----->indexer logstash---->search storage<--------Web Logstash
logstash3----|
ELS的概念:
1、索引:数据会放在多个索引中,索引可以理解为database,索引里面存放的基本单位是文档,LES会把索引分片,便于横向扩展,分别可以做备份,多个分片读比较快,备份分片在主的挂掉之后可以自动将自己提升为主分片(实现横向扩展和冗余)
2、文档类型:和redis一样,key是有类型的
3、节点:一个ELS的实例是一个节点
4、集群:多节点的集合组成集群,类似于zookeeper会选举出主节点,客户端不需要关注主节点,连接任何一个都可以,数据会自动同步,因此应用不需要关注那个是主节点。前提是要把
配置文件:
[root@elk-server1 config]# vim elasticsearch.yml
cluster.name: hfelk-server  #集群的名称,名称相同就是一个集群
node.name: Server1  #集群情况下,当前node的名字,每个node应该不一样
node.master: true  #当前节点是否可以被选举为master节点,可以不选举master做保存数据
node.data: true #当前节点是否存储数据,也可以不存储数据,只做master
bootstrap.mlockall: true #锁住内存,不做swap,提高效率
http.port: 9200  #客户端访问端口
transport.tcp.port: 9300 #集群访问端口:
index.number_of_shards: 5 #默认每个项目5个分片
index.number_of_replicas: 1  #每个主分片一个副本分片,即5个主分片就有5个副本
二:安装及配置:
官网下载地址:
https://www.elastic.co/downloads
官方文档:
https://www.elastic.co/guide/index.html
1、安装:
安装java环境,1.8.20或以上的版本
配置yum源或使用源码安装
2、启动:
 /usr/local/elasticsearch/bin/elasticsearch  -d  #后台进程方式启动
/etc/init.d/elasticsearch  restart
3、设置启动脚本:
下载:elasticsearch-servicewrapper-master.zip
[root@elk-server1 tianqi]# mv elasticsearch-servicewrapper-master/service/ /usr/local/elasticsearch/bin/
帮助信息:
[root@elk-server1 tianqi]# /usr/local/elasticsearch/bin/service/elasticsearch
Usage: /usr/local/elasticsearch/bin/service/elasticsearch [ console | start | stop | restart | condrestart | status | install | remove | dump ]

Commands:
  console      Launch in the current console.
  start        Start in the background as a daemon process.
  stop         Stop if running as a daemon or in another console.
  restart      Stop if running and then start.
  condrestart  Restart only if already running.
  status       Query the current status.
  install      Install to start automatically when system boots.
  remove       Uninstall.
  dump         Request a Java thread dump if running.
4、安装启动脚本:
[root@elk-server1 tianqi]# /usr/local/elasticsearch/bin/service/elasticsearch install  #安装脚本
Detected RHEL or Fedora:
Installing the Elasticsearch daemon..
[root@elk-server1 tianqi]# ls /etc/init.d/elasticsearch  #验证是否安装完成
/etc/init.d/elasticsearch
[root@elk-server1 tianqi]# chkconfig  --list | grep ela #自动设置为开机启动
elasticsearch      0:off    1:off    2:on    3:on    4:on    5:on    6:off
5、启动elasticsearch服务:
[root@elk-server1 tianqi]# /etc/init.d/elasticsearch   start
Starting Elasticsearch...
Waiting for Elasticsearch......
running: PID:14183
[root@elk-server1 tianqi]# /etc/init.d/elasticsearch   status
Elasticsearch is running: PID:14183, Wrapper:STARTED, Java:STARTED
6、java的配置文件:
[root@elk-server1 service]# ls /usr/local/elasticsearch/bin/service/elasticsearch.conf
9200:访问的都端口
9300:服务器之间通信的端口
7、测试:
[root@elk-server1 elasticsearch]# curl  -i -XGET http://192.168.0.251:9200
HTTP/1.1 200 OK
Content-Type: application/json; charset=UTF-8
Content-Length: 335

{
  "status" : 200,
  "name" : "Server1",
  "cluster_name" : "HFELK-Server1",
  "version" : {
    "number" : "1.7.0",
    "build_hash" : "929b9739cae115e73c346cb5f9a6f24ba735a743",
    "build_timestamp" : "2015-07-16T14:31:07Z",
    "build_snapshot" : false,
    "lucene_version" : "4.10.4"
  },
  "tagline" : "You Know, for Search"
}
三:ES 概念和集群:
1、基于http的RESTful API
以jsop返回查询结果:
[root@elk-server1 config]# curl  -XGET  'http://192.168.0.251:9200/_count?pretty' -d '
> {
>     "query":{
>            "match_all":{}
>       }
> }
>
> '
{
  "count" : 1,
  "_shards" : {
    "total" : 1,
    "successful" : 1,
    "failed" : 0
  }
}
curl -i:
[root@elk-server1 config]# curl  -i -XGET  'http://192.168.0.251:9200/_count?pretty' -d '
{
    "query":{
           "match_all":{}
      }
}

'
HTTP/1.1 200 OK
Content-Type: application/json; charset=UTF-8
Content-Length: 95

{
  "count" : 1,
  "_shards" : {
    "total" : 1,
    "successful" : 1,
    "failed" : 0
  }
}
2、安装ELS监控管理插件:
[root@elk-server1 service]# /usr/local/elasticsearch/bin/plugin  -i elasticsearch/marvel/latest/
-> Installing elasticsearch/marvel/latest/...
Trying http://download.elasticsearch.org/elasticsearch/marvel/marvel-latest.zip...
Downloading ......................................................................................................................................................................................................................................................DONE
Installed elasticsearch/marvel/latest/ into /usr/local/elasticsearch/plugins/marvel
3、web访问:http://xx.chinacloudapp.cn:9200/_plugin/marvel/
选选免费试用:

4、进入测试界面:
5、界面效果:
提交内容:
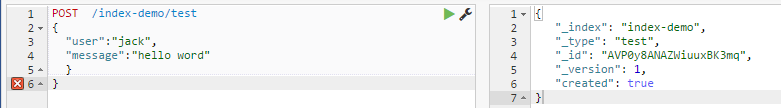
6、提交的代码如下:
POST  /index-demo/test
{
  "user":"jack",
  "message":"hello word"
  }
}
7、 查看和删除指定文档内容:
GET  /index-demo/test/AVP0y8ANAZWiuuxBK3mq/_source
DELETE  /index-demo/test/AVP0y8ANAZWiuuxBK3mq/_source
8、搜索文档:
GET  /index-demo/test/_search?q=hello

{
   "took": 97,
   "timed_out": false,
   "_shards": {
      "total": 5,
      "successful": 5,
      "failed": 0
   },
   "hits": {
      "total": 1,
      "max_score": 0.15342641,
      "hits": [
         {
            "_index": "index-demo",
            "_type": "test",
            "_id": "AVP0y8ANAZWiuuxBK3mq",
            "_score": 0.15342641,
            "_source": {
               "user": "jack",
               "message": "hello word"
            }
         }
      ]
   }
}
四:elasticsearch集群管理程序之head:
1、安装集群的管理插件head:
集群更换了虚拟机环境,所以主机名不一样,安装的时候要多安装几次,有的时候会因为网络问题无法一次 安装完成。
[root@node6 local]#  /usr/local/elasticsearch/bin/plugin  -i mobz/elasticsearch-head/
-> Installing mobz/elasticsearch-head/...
Trying https://github.com/mobz/elasticsearch-head/archive/master.zip...
Downloading ....................................................................................................................................................................................................................................................................................................................................................................................................................................................................................................................................................................................................................................................................................DONE
Installed mobz/elasticsearch-head/ into /usr/local/elasticsearch/plugins/head
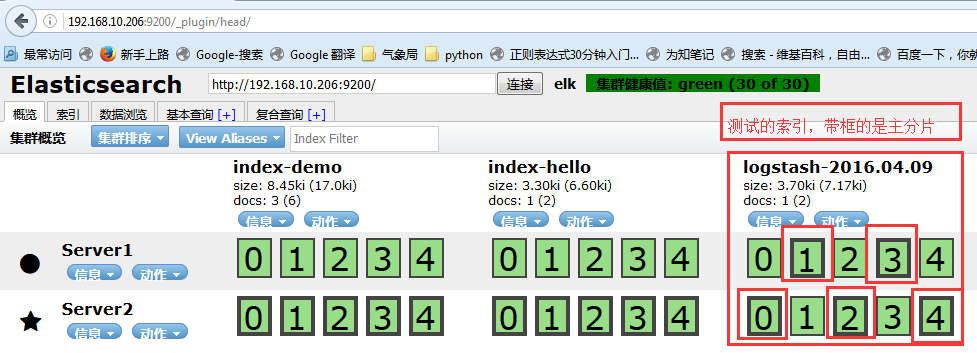
2、打开web管理端,查看是否已经有本机被管理了:
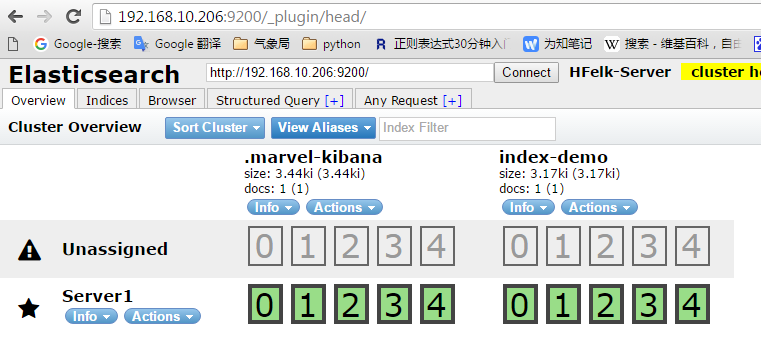
3、在另外一台主机上配置好java和elasticsearch,配置文件只要吧node节点的名字改了就行,其他的不需要改,然后配置脚本启动服务,再把elasticsearch启动即可,会自动在集群显示,推荐三台或以上的节点,因为其中一台主机挂掉不影响整个服务的访问
绿色代表分片都正常运行,20个分片都正常,表示集群非常健康
黄色表示所有主分片都正常,但是副本分片有丢失,意味着ELS可以正常工作,但是有一定的风险,性能也不是最好的
红色代表有主分片丢失,此部分数据就无法使用了
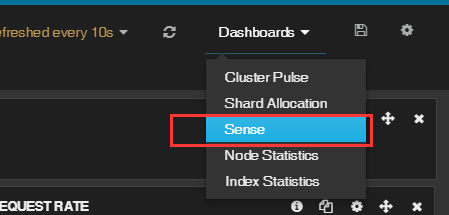
4、成功的集群效果:

5、以上是在监控程序marvel的界面创建了两个项目:
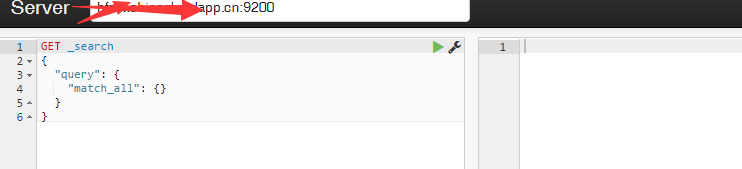
打开连接:http://192.168.10.206:9200/_plugin/marvel/sense/index.html
POST  /index-demo/hi
{
  "user":"tom1",
  "message":"hello word"
  }
}

POST  /index-hello/hi
{
  "user":"tom1",
  "message":"hello word"
  }
}
##############################################################################################
一:文档
官方文档地址:1.x版本和2.x版本
https://www.elastic.co/guide/en/elasticsearch/guide/index.html
硬件要求:
1、内存,官方推荐64G,但是自己使用32G或16G也可以
2、CPU,核心越多越好
3、硬盘,越快越好,不建议使用NAS网络存储,官方建议使用RAID 0
4、网络,千兆或以上
5、JVM,建议使用比较新的版本,可以是openJDK或oracle的Java JDK
6、文件描述符,即可以打开的最大文件数,一定要改大
7、cluster 同一个集群要一样,集群被的各node name不能相同
8、组播和单播设置
9、JDK 内存设置不要超过32G,可以关闭Swap分区
10、锁住内存设置
动态改变配置:
PUT /_cluster/settings
{
    "persistent" : {
        "discovery.zen.minimum_master_nodes" : 2
    },
    "transient" : {
        "indices.store.throttle.max_bytes_per_sec" : "50mb"
    }
}
滚动升级或维护:
1、尽量不写新的数据,就不产生新的索引
2、关闭自动分片:
PUT /_cluster/settings
{
    "transient" : {
        "cluster.routing.allocation.enable" : "none"
    }
}
3、关闭当前节点:
停止后会在集群当中找其他的几点并提升为主节点,并将被停止的节点的分片分配给其他节点,并将数据同步到其他节点。
POST /_cluster/nodes/_local/_shutdown
4、执行升级或维护操作
5、重启节点,会自动加入到集群
6、开启当前节点的分片功能
注意:即分片同步需要一段时间,需要等待集群状态转换为绿色即集群可用状态。
Shard rebalancing may take some time. Wait until the cluster has returned to status green before continuing.
7、对集群当中的其他节点做2-6步骤的操作
数据备份--->快照备份:curl
1、创建备份目录,节点之间需要共享一个目录,共享的文件系统需要每个节点都可以访问,并且每个节点可挂载的路径要一致
支持的共享系统:
Shared filesystem, such as a NAS
Amazon S3
HDFS (Hadoop Distributed File System)
Azure Cloud
执行挂载目录的命令:
PUT _snapshot/my_backup
{
    "type": "fs",
    "settings": {
        "location": "/mount/backups/my_backup"
    }
}
2、创建快照:
POST _snapshot/my_backup/
{
    "type": "fs",
    "settings": {
        "location": "/mount/backups/my_backup",
        "max_snapshot_bytes_per_sec" : "50mb",
        "max_restore_bytes_per_sec" : "50mb"
    }
}
ELK的工作原理:
使用多播进行机器发现同一个集群内的节点,并汇总各个节点的返回组成一个集群,主节点要读取各个节点的状态,在关键的时候进行数据的恢复,主节点会坚持各个节点的状态,并决定每个分片的位置,通过ping的request检测各失效的节点
三:安装logstash:
官网下载地址:
https://www.elastic.co/downloads/logstash
1、安装:
tar xvf logstash-1.5.3.zip
mv logstash-1.5.3 /usr/local/logstash
2、测试:
[root@node6 ~]# /usr/local/logstash/bin/logstash -e 'input { stdin{} }  output { stdout{} }'
test
Logstash startup completed
2016-04-09T18:14:47.891Z node6.a.com test
3、使用ruby进行更详细的输出:
需要主机能解析自己的主机名,可以在hosts文件解析:
[root@node6 ~]# /usr/local/logstash/bin/logstash -e 'input { stdin{} }  output { stdout{codec => rubydebug}}'
asd
Logstash startup completed
{
       "message" => "asd",
      "@version" => "1",
    "@timestamp" => "2016-04-09T18:13:51.250Z",
          "host" => "node6.a.com"
}
4、通过logstas将输出交给elasticsearch:
启动:
[root@node6 ~]# /usr/local/logstash/bin/logstash -e 'input { stdin{} }  output {  elasticsearch { host => "192.168.10.206" protocol => "http"}  }'
'[DEPRECATED] use `require 'concurrent'` instead of `require 'concurrent_ruby'`
Logstash startup completed
5、通过logstash直接输出到屏幕:
#配置文件如下:
input {
        stdin{

        }
}

output {
  stdout { codec => rubydebug }
}
测试标准输出:
[root@elk-server2 conf.d]# /opt/logstash/bin/logstash -f /etc/logstash/conf.d/03.conf
       "message" => "{"@timestamp":"2016-05-14T11:24:45+08:00","host":"192.168.0.22","clientip":"36.104.21.88","size":650,"responsetime":0.000,"upstreamtime":"-","upstreamhost":"-","http_host":"webapi.weather.com.cn","url":"/data/","domain":"webapi.weather.com.cn","xff":"-","referer":"-","status":"200"}",
      "@version" => "1",
    "@timestamp" => "2016-05-14T03:25:04.068Z",
          "host" => "elk-server2"
6、输入一个hello word! 以进行测试:
[root@node6 ~]# /usr/local/logstash/bin/logstash -e 'input { stdin{} }  output {  elasticsearch { host => "192.168.10.206" protocol => "http"}  }'
'[DEPRECATED] use `require 'concurrent'` instead of `require 'concurrent_ruby'`
Logstash startup completed
hello word!
7、查看集群管理软件head的状态:
8、进行基本查询:

9、配置文件格式:
input {
  file {
    path => "/var/log/messages"
    type => "syslog"
  }

  file {
    path => "/var/log/apache/access.log"
    type => "apache"
  }
}
10、数组类型--->多个文件:
  path => [ "/var/log/messages", "/var/log/*.log" ] #通过*匹配多个文件
  path => "/data/mysql/mysql.log"
11、bool类型:
ssl_enable => true
12、字节设置:
  my_bytes => "1113"   # 1113 bytes
  my_bytes => "10MiB"  # 10485760 bytes
  my_bytes => "100kib" # 102400 bytes
  my_bytes => "180 mb" # 180000000 bytes
13、codec:
codec => "json"
14、Hash:
match => {
  "field1" => "value1"
  "field2" => "value2"
  ...
}
15、Number--->数字:
port => 33
16、Path--->密码:
my_password => "password"
17、Path---->路径:
my_path => "/tmp/logstash"
18、string-->字符串:
name => "Hello world"
四:logstash的input使用语法:
1、input,默认不支持目录的递归,即目录中还有文件是不支持直接读取的,但是可以使用*/*进行匹配。
2、exclude--->排除文件,
exclude => "*.gz"
3、sincedb_path,记录读取的时候位置,默认是一个隐藏文件
4、sincedb_write_interval,记录sincedb_path文件的写间隔,默认是15秒
5、start_position,从这个文件的什么位置开始读,默认是end,可以改成beginning
6、stat_interval,多久检测一次此文件的更新状态
五:logstash的output使用及插件:
1、可以输出到文件、rendis等
2、gzip,是否压缩,默认为false,压缩是安装数据流一点点增量压缩的
3、message_format,消息的格式
六:logstash --> file -->elasticsearch:
通过logstash输出到文件在输入到elasticsearch:
1、启动脚本:
vim /etc/init.d/logstash
[root@node6 tmp]# cat /etc/init.d/logstash
#!/bin/sh
# Init script for logstash
# Maintained by Elasticsearch
# Generated by pleaserun.
# Implemented based on LSB Core 3.1:
#   * Sections: 20.2, 20.3
#
### BEGIN INIT INFO
# Provides:          logstash
# Required-Start:    $remote_fs $syslog
# Required-Stop:     $remote_fs $syslog
# Default-Start:     2 3 4 5
# Default-Stop:      0 1 6
# Short-Description:
# Description:        Starts Logstash as a daemon.
### END INIT INFO

PATH=/sbin:/usr/sbin:/bin:/usr/bin:/usr/local/logstash/bin/
export PATH

if [ `id -u` -ne 0 ]; then
   echo "You need root privileges to run this script"
   exit 1
fi

name=logstash
pidfile="/var/run/$name.pid"

export JAVA_HOME=/opt/jdk1.8.0_45
export JRE_HOME=/opt/jdk1.8.0_45/jre
export CLASSPATH=.:$JAVA_HOME/lib/dt.jar:$JAVA_HOME/lib/tools.jar:$JRE_HOME/lib:$CLASSPATH
export PATH=$JAVA_HOME/bin:$PATH


LS_USER=root
LS_GROUP=root
LS_HOME=/usr/local/logstash
LS_HEAP_SIZE="512m"
LS_LOG_DIR=/usr/local/logstash
LS_LOG_FILE="${LS_LOG_DIR}/$name.log"
LS_CONF_DIR=/etc/logstash.conf
LS_OPEN_FILES=16384
LS_NICE=19
LS_OPTS=""


[ -r /etc/default/$name ] && . /etc/default/$name
[ -r /etc/sysconfig/$name ] && . /etc/sysconfig/$name

program=/usr/local/logstash/bin/logstash
args="agent -f ${LS_CONF_DIR} -l ${LS_LOG_FILE} ${LS_OPTS}"

quiet() {
  "$@" > /dev/null 2>&1
  return $?
}

start() {

  LS_JAVA_OPTS="${LS_JAVA_OPTS} -Djava.io.tmpdir=${LS_HOME}"
  HOME=${LS_HOME}
  export PATH HOME LS_HEAP_SIZE LS_JAVA_OPTS LS_USE_GC_LOGGING

  # chown doesn't grab the suplimental groups when setting the user:group - so we have to do it for it.
  # Boy, I hope we're root here.
  SGROUPS=$(id -Gn "$LS_USER" | tr " " "," | sed 's/,$//'; echo '')

  if [ ! -z $SGROUPS ]
  then
    EXTRA_GROUPS="--groups $SGROUPS"
  fi

  # set ulimit as (root, presumably) first, before we drop privileges
  ulimit -n ${LS_OPEN_FILES}

  # Run the program!
  nice -n ${LS_NICE} chroot --userspec $LS_USER:$LS_GROUP $EXTRA_GROUPS / sh -c "
    cd $LS_HOME
    ulimit -n ${LS_OPEN_FILES}
    exec "$program" $args
  " > "${LS_LOG_DIR}/$name.stdout" 2> "${LS_LOG_DIR}/$name.err" &

  # Generate the pidfile from here. If we instead made the forked process
  # generate it there will be a race condition between the pidfile writing
  # and a process possibly asking for status.
  echo $! > $pidfile

  echo "$name started."
  return 0
}

stop() {
  # Try a few times to kill TERM the program
  if status ; then
    pid=`cat "$pidfile"`
    echo "Killing $name (pid $pid) with SIGTERM"
    kill -TERM $pid
    # Wait for it to exit.
    for i in 1 2 3 4 5 ; do
      echo "Waiting $name (pid $pid) to die..."
      status || break
      sleep 1
    done
    if status ; then
      if [ "$KILL_ON_STOP_TIMEOUT" -eq 1 ] ; then
        echo "Timeout reached. Killing $name (pid $pid) with SIGKILL. This may result in data loss."
        kill -KILL $pid
        echo "$name killed with SIGKILL."
      else
        echo "$name stop failed; still running."
      fi
    else
      echo "$name stopped."
    fi
  fi
}

status() {
  if [ -f "$pidfile" ] ; then
    pid=`cat "$pidfile"`
    if kill -0 $pid > /dev/null 2> /dev/null ; then
      # process by this pid is running.
      # It may not be our pid, but that's what you get with just pidfiles.
      # TODO(sissel): Check if this process seems to be the same as the one we
      # expect. It'd be nice to use flock here, but flock uses fork, not exec,
      # so it makes it quite awkward to use in this case.
      return 0
    else
      return 2 # program is dead but pid file exists
    fi
  else
    return 3 # program is not running
  fi
}

force_stop() {
  if status ; then
    stop
    status && kill -KILL `cat "$pidfile"`
  fi
}

configtest() {
  # Check if a config file exists
  if [ ! "$(ls -A ${LS_CONF_DIR}/* 2> /dev/null)" ]; then
    echo "There aren't any configuration files in ${LS_CONF_DIR}"
    return 1
  fi

  HOME=${LS_HOME}
  export PATH HOME JAVA_OPTS LS_HEAP_SIZE LS_JAVA_OPTS LS_USE_GC_LOGGING

  test_args="-f ${LS_CONF_DIR} --configtest ${LS_OPTS}"
  $program ${test_args}
  [ $? -eq 0 ] && return 0
  # Program not configured
  return 6
}

case "$1" in
  start)
    status
    code=$?
    if [ $code -eq 0 ]; then
      echo "$name is already running"
    else
      start
      code=$?
    fi
    exit $code
    ;;
  stop) stop ;;
  force-stop) force_stop ;;
  status)
    status
    code=$?
    if [ $code -eq 0 ] ; then
      echo "$name is running"
    else
      echo "$name is not running"
    fi
    exit $code
    ;;
  restart)
    quiet configtest
    RET=$?
    if [ ${RET} -ne 0 ]; then
      echo "Configuration error. Not restarting. Re-run with configtest parameter for details"
      exit ${RET}
    fi
    stop && start
    ;;
  configtest)
    configtest
    exit $?
    ;;
  *)
    echo "Usage: $SCRIPTNAME {start|stop|force-stop|status|restart|configtest}" >&2
    exit 3
  ;;
esac

exit $?
2、设置开机启动:
chmod  a+x /etc/init.d/logstash
chkconfig  --add logstash
3、编辑配置文件:
[root@node6 tmp]# vim /etc/logstash.conf
input {
        file {
                path =>  "/var/log/messages"
        }
}


output {
        file {
                path => "/tmp/log-%{+YYYY-MM-dd}messages.gz"
                gzip => true
        }
}
4、测试:
[root@node6 tmp]# echo "Apr 12 14:03:53 HTC-Server2 snmpd[1573]: Connection from UDP: [60.195.252.107]:31001->[192.168.0.116]" >> /var/log/messages
测试结果:
[root@node6 tmp]# ls  /tmp/
hsperfdata_root  log-2016-04-09.messages.gz
5、把输出直接传输到elasticsearch:
[root@node6 ~]# vim /etc/logstash.conf
input {
        file {
                path =>  "/var/log/messages"
        }
}


output {
        file {
                path => "/tmp/log-%{+YYYY-MM-dd}.messages.gz"
                gzip => true
        }

        elasticsearch {
                host => ["192.168.10.206"]
                protocol => "http"
                index => "system-message-%{+YYYY.MM.dd}"
        }
}
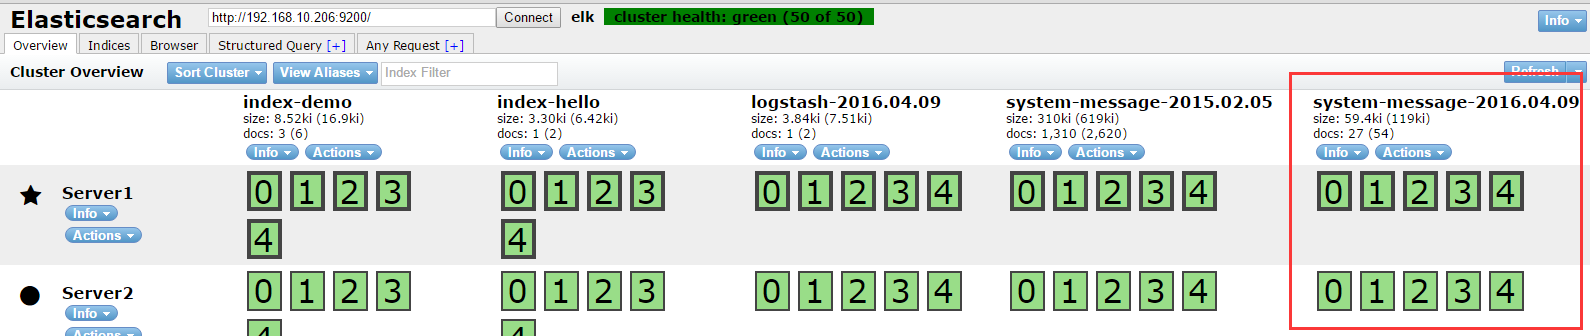
6、在集群管理平台查看结果:
七:将logstash输出给redis:
1、基本语法:
db:使用的数据库,默认为0,也可以使用其他的,但是redis主从不支持其他数据库同步。
host: redis服务器的地址
key:key的名称
password:redis服务器的redis连接密码
port:redis端口,默认6379
data_type:数据类型,支持string和list,我们使用list
2、重启logstash
3、向logstash监控的文件写入数据
[root@node6 yum.repos.d]# echo "Apr 12 14:03:53 HTC-Server2 snmpd[1573]: Connection from UDP: [60.195.252.107]:31001->[192.168.0.116]" >>  /var/log/messages
[root@node6 yum.repos.d]# echo "Apr 12 14:03:53 HTC-Server2 snmpd[1573]: Connection from UDP: [60.195.252.107]:31001->[192.168.0.116]" >>  /var/log/messages
[root@node6 yum.repos.d]# echo "Apr 12 14:03:53 HTC-Server2 snmpd[1573]: Connection from UDP: [60.195.252.107]:31001->[192.168.0.116]" >>  /var/log/messages
[root@node6 yum.repos.d]# echo "Apr 12 14:03:53 HTC-Server2 snmpd[1573]: Connection from UDP: [60.195.252.107]:31001->[192.168.0.116]" >>  /var/log/messages
[root@node6 yum.repos.d]# echo "Apr 12 14:03:53 HTC-Server2 snmpd[1573]: Connection from UDP: [60.195.252.107]:31001->[192.168.0.116]" >>  /var/log/messages
[root@node6 yum.repos.d]# echo "Apr 12 14:03:53 HTC-Server2 snmpd[1573]: Connection from UDP: [60.195.252.107]:31001->[192.168.0.116]" >>  /var/log/messages
4、到redis查看结果:
[root@node5 ~]# redis-cli
127.0.0.1:6379> KEYS *
1) "system-message-jack" #已经生成数据
127.0.0.1:6379> LLEN  system-message-jack #查看key的长度
(integer) 681
127.0.0.1:6379> LINDEX system-message-jack -1  #查看最后一行数据
"{"message":"Apr 12 14:03:53 HTC-Server2 snmpd[1573]: Connection from UDP: [60.195.252.107]:31001->[192.168.0.116]","@version":"1","@timestamp":"2016-04-12T08:37:51.025Z","host":"node6.a.com","path":"/var/log/messages"}"
5、在重新找一台机器安装logstash,步骤参考之前的步骤:
6、另外一台logstash的配置文件:
input {   #读取redis的数据
    redis {
        data_type => "list"
        key => "system-message-jack"
        host => "192.168.10.205"
        port => "6379"
        db => "0"
    }
}


output {  #将读取到的reids的数据写入到elasticsearch
    elasticsearch {
        host => ["192.168.10.206"]
        protocol => "http"
        index => "redis-message-%{+YYYY.MM.dd}"
    }
}
7、向message文件写入数据,写入的数据会读取到redis,reids的数据则会被传输给
[root@node6 yum.repos.d]# echo "Apr 12 14:03:53 HTC-Server2 snmpd[1573]: Connection from UDP: [60.195.252.107]:31001->[192.168.0.116]" >>  /var/log/messages
[root@node6 yum.repos.d]# echo "Apr 12 14:03:53 HTC-Server2 snmpd[1573]: Connection from UDP: [60.195.252.107]:31001->[192.168.0.116]" >>  /var/log/messages
[root@node6 yum.repos.d]# echo "Apr 12 14:03:53 HTC-Server2 snmpd[1573]: Connection from UDP: [60.195.252.107]:31001->[192.168.0.116]" >>  /var/log/messages
[root@node6 yum.repos.d]# echo "Apr 12 14:03:53 HTC-Server2 snmpd[1573]: Connection from UDP: [60.195.252.107]:31001->[192.168.0.116]" >>  /var/log/messages
8、在集群管理平台查看:

9、 查看索引:

八:分析的日志类型:
1、系统日志:/var/log下的所有的内容,google每一个文件的内容
2、通过ELS分析某一个访问记录
3、错误日志,收集后反馈给开发
4、系统运行日志
5、其他类型的日志
九:日志的字段划分:
1、grok模块:通过正则表达式,比较复杂,而且当数据大的时候会占用CPU
2、json,简单易用
3、将nginx的日志设置为json模式:
安装nginx:可以编译或yum安装,省略
4、日志配置部分:
http {
    include       /etc/nginx/mime.types;
    default_type  application/octet-stream;

   # log_format  main  '$remote_addr - $remote_user [$time_local] "$request" '
   #                   '$status $body_bytes_sent "$http_referer" '
   #                   '"$http_user_agent" "$http_x_forwarded_for"';

    #access_log  /var/log/nginx/access.log  main;

    log_format logstash_json '{"@timestamp":"$time_iso8601",' #定义日志格式logstash_json
        '"host":"$server_addr",'
        '"clientip":"$remote_addr",'
        '"size":$body_bytes_sent,'
        '"responsetime":$request_time,'
        '"upstreamtime":"$upstream_response_time",'
        '"upstreamhost":"$upstream_addr",'
        '"http_host":"$host",'
        '"url":"$uri",'
        '"domain":"$host",'
        '"xff":"$http_x_forwarded_for",'
        '"referer":"$http_referer",'
        '"agent":"$http_user_agent",'
        '"status":"$status"}';


    sendfile        on;

serevr配置:
#
server {
    listen       9009;
    server_name  localhost;

    #charset koi8-r;

    access_log  /var/log/nginx/json.access.log  logstash_json;  #日志文件保存路径及使用上面定义的日志格式logstash_json
    # Load configuration files for the default server block.
    include /etc/nginx/default.d/*.conf;

    location / {
        root   /usr/share/nginx/html;
        index  index.html index.htm;
    }

    error_page  404              /404.html;
    location = /404.html {
        root   /usr/share/nginx/html;
    }

    # redirect server error pages to the static page /50x.html
    #
    error_page   500 502 503 504  /50x.html;
    location = /50x.html {
        root   /usr/share/nginx/html;
    }
5、使用ab访问nginx测试日志:
[root@node5 nginx]# ab -n1000 -c10 http://192.168.10.205:9009/ #一共1000个请求,每次并发10个,即100次请求完成
6、查看日志是否有内容:
[root@node5 nginx]# tail /var/log/nginx/json.access.log
{"@timestamp":"2016-04-12T18:21:31+08:00","host":"192.168.10.205","clientip":"192.168.10.205","size":3698,"responsetime":0.000,"upstreamtime":"-","upstreamhost":"-","http_host":"192.168.10.205","url":"/index.html","domain":"192.168.10.205","xff":"-","referer":"-","agent":"ApacheBench/2.3","status":"200"}
{"@timestamp":"2016-04-12T18:21:31+08:00","host":"192.168.10.205","clientip":"192.168.10.205","size":3698,"responsetime":0.000,"upstreamtime":"-","upstreamhost":"-","http_host":"192.168.10.205","url":"/index.html","domain":"192.168.10.205","xff":"-","referer":"-","agent":"ApacheBench/2.3","status":"200"}
{"@timestamp":"2016-04-12T18:21:31+08:00","host":"192.168.10.205","clientip":"192.168.10.205","size":3698,"responsetime":0.000,"upstreamtime":"-","upstreamhost":"-","http_host":"192.168.10.205","url":"/index.html","domain":"192.168.10.205","xff":"-","referer":"-","agent":"ApacheBench/2.3","status":"200"}
{"@timestamp":"2016-04-12T18:21:31+08:00","host":"192.168.10.205","clientip":"192.168.10.205","size":3698,"responsetime":0.000,"upstreamtime":"-","upstreamhost":"-","http_host":"192.168.10.205","url":"/index.html","domain":"192.168.10.205","xff":"-","referer":"-","agent":"ApacheBench/2.3","status":"200"}
{"@timestamp":"2016-04-12T18:21:31+08:00","host":"192.168.10.205","clientip":"192.168.10.205","size":3698,"responsetime":0.001,"upstreamtime":"-","upstreamhost":"-","http_host":"192.168.10.205","url":"/index.html","domain":"192.168.10.205","xff":"-","referer":"-","agent":"ApacheBench/2.3","status":"200"}
{"@timestamp":"2016-04-12T18:21:31+08:00","host":"192.168.10.205","clientip":"192.168.10.205","size":3698,"responsetime":0.000,"upstreamtime":"-","upstreamhost":"-","http_host":"192.168.10.205","url":"/index.html","domain":"192.168.10.205","xff":"-","referer":"-","agent":"ApacheBench/2.3","status":"200"}
{"@timestamp":"2016-04-12T18:21:31+08:00","host":"192.168.10.205","clientip":"192.168.10.205","size":3698,"responsetime":0.000,"upstreamtime":"-","upstreamhost":"-","http_host":"192.168.10.205","url":"/index.html","domain":"192.168.10.205","xff":"-","referer":"-","agent":"ApacheBench/2.3","status":"200"}
{"@timestamp":"2016-04-12T18:21:31+08:00","host":"192.168.10.205","clientip":"192.168.10.205","size":3698,"responsetime":0.000,"upstreamtime":"-","upstreamhost":"-","http_host":"192.168.10.205","url":"/index.html","domain":"192.168.10.205","xff":"-","referer":"-","agent":"ApacheBench/2.3","status":"200"}
{"@timestamp":"2016-04-12T18:21:31+08:00","host":"192.168.10.205","clientip":"192.168.10.205","size":3698,"responsetime":0.000,"upstreamtime":"-","upstreamhost":"-","http_host":"192.168.10.205","url":"/index.html","domain":"192.168.10.205","xff":"-","referer":"-","agent":"ApacheBench/2.3","status":"200"}
{"@timestamp":"2016-04-12T18:21:31+08:00","host":"192.168.10.205","clientip":"192.168.10.205","size":3698,"responsetime":0.000,"upstreamtime":"-","upstreamhost":"-","http_host":"192.168.10.205","url":"/index.html","domain":"192.168.10.205","xff":"-","referer":"-","agent":"ApacheBench/2.3","status":"200"}
7、配置logstash手机nginx的json日志并写入到redis:
[root@node5 logstash]# cat /etc/logstash.conf
input {
#    redis {
#        data_type => "list"
#        key => "system-message-jack"
#        host => "192.168.10.205"
#        port => "6379"
#        db => "0"
#    }

    file {
        path => "/var/log/nginx/json.access.log" #读取指定的json格式的日志
        codec => "json" #指定json格式
    }

}


output {
#    elasticsearch {
#        host => ["192.168.10.206"]
#        protocol => "http"
#        index => "redis-message-%{+YYYY.MM.dd}"
#    }
    redis {
        data_type => "list"
        key => "nginx-json-log" #nginx的json格式日志的key名称
        host => "192.168.10.205" #写入到redis服务器
        port => "6379"
        db => "1" #使用redis的数据库1
    }
}
8、重启logstash服务,并使用ab重新访问web地址,以产生新的日志写入redis:
|
1
|
[root@node5 nginx]# ab -n1000 -c10 http://192.168.10.205:9009/ |
9、在redis查询是否有当前key的日志:
[root@node5 nginx]# redis-cli
127.0.0.1:6379> SELECT 1
OK
127.0.0.1:6379[1]> KEYS *
1) "nginx-json-log"  #已有日志
127.0.0.1:6379[1]> LLEN nginx-json-log  #日志长度
(integer) 1000
10、配置logstash当前redis日志并输出至elasticsearch:
[root@node5 nginx]# grep "#" -v  /etc/logstash.conf
input {
    redis {
        data_type => "list"
        key => "nginx-json-log"
        host => "192.168.10.205"
        port => "6379"
        db => "1"
    }
}

output {
    elasticsearch {
        host => ["192.168.10.206"]
        protocol => "http"
        index => "nginx-json-log-%{+YYYY.MM.dd}"
    }
}
11、重启logstash并使用ab批量访问web,再查看elasticsearch集群管理界面是否有nginx的json定义的nginx-json-log的key出现:

################################################################################################
一:kibana安装:
kibana主要是搜索elasticsearch的数据,并进行数据可视化的展现,新版使用nodejs。
1、下载地址:
https://www.elastic.co/downloads/kibana
2、解压安装:
[root@node6 local]# tar xvf kibana-4.1.1-linux-x64.tar.gz
[root@node6 local]# mv kibana-4.1.1-linux-x64 kibana
[root@node6 ~]# cd /usr/local/kibana/
[root@node6 kibana]# ls
bin config LICENSE.txt node plugins README.txt src
3、编辑配置文件:
[root@node6 kibana]# cd config/
[root@node6 config]# ls
kibana.yml
[root@node6 config]# vim kibana.yml
elasticsearch_url: "http://192.168.10.206:9200"
4、直接启动:
[root@node6 kibana]# bin/kibana
{"name":"Kibana","hostname":"node6.a.com","pid":3942,"level":30,"msg":"No existing kibana index found","time":"2016-04-12T12:20:50.069Z","v":0}
{"name":"Kibana","hostname":"node6.a.com","pid":3942,"level":30,"msg":"Listening on 0.0.0.0:5601","time":"2016-04-12T12:20:50.096Z","v":0}
5、验证启动:
[root@node6 ~]# ps -ef | grep  kibana
root       3942   3745  3 20:20 pts/2    00:00:01 bin/../node/bin/node bin/../src/bin/kibana.js
root       3968   3947  0 20:21 pts/3    00:00:00 grep kibana
[root@node6 ~]# ss -tnl | grep 5601
LISTEN     0      128                       *:5601                     *:*
6、后台启动:
[root@node6 kibana]# nohup  bin/kibana &
[1] 3975
7、访问测试:默认监听端口5601
http://192.168.10.206:5601

8、配置索引:索引的名称要和logstash的output生成的索引能进行匹配才可以
9、查看数据:默认显示最新的500个文档

10、数据精确搜索:

11、搜索高级语法:
status:404 OR status:500  #搜索状态是404或者是500之一的
status:301 AND status:200  #搜索即是301和200同时匹配的
status:[200 TO 300] :搜索指定范围的
12、保存常用的搜索语法:


二:其他的常用模块:
1、系统日志收集---> syslog:配置syslog结果写入到elasticsearch,指定端口514,主机就是要收集日志的服务器IP地址,即可使用
2、访问日志:nginx转换成json格式
3、错误日志:使用codec插件:
https://www.elastic.co/guide/en/logstash/1.5/codec-plugins.html
input {
  stdin {
    codec => multiline {  #多行日志,比如java的日志
      pattern => "^s"  #pattern => ".*	.*"  #找到换行符,会把多行认为是一行,即会把当前行和上一行合成一行,直到有换行符结束
      what => "previous"
    }
  }
}
4、运行日志 codec => json,如果不是json要使用grok进行匹配,相对比较麻烦,如果丢日志就看logstash.log,另外检查日志是否有效的json格式:
json效验地址:http://www.bejson.com/

5、kibana的时区和时间问题:kibana会自动根据浏览器将时间加8小时,通过logstash写入会自动解决,如果通过python脚本等写入会产生时间问题
6、在地图显示IP具体来源地址:
https://www.elastic.co/guide/en/logstash/1.5/filter-plugins.html
7、条件判断:
input {
  file {
    type => "apache"
    path => "/var/log/apache.log"
  }
  file {
    type => "tomcat"
    path => "/var/log/tomcat.log"
  }
}

filter {
  if [type] == "apache" { #假如索引为apache,就执行以下操作
    redis {
    data_type => "list"
    key => "system-message-jack"
    host => "192.168.10.205"
    port => "6379"
    db => "0"
    }
  if [type] == "tomcat" { #假如索引为tomcat,就执行一次操作
    redis {
    data_type => "list"
    key => "system-message-tomcat"
    host => "192.168.10.205"
    port => "6379"
    db => "1" #写不同的数据库
     }
}
nginx 最好设置buffer大小,64k
kibana要添加elastsearch的key
搜索的语法:直接搜索键值 a:b AND ALL NOT进行匹配。范围 [200-299]
6.测试logstash配置文件语法是否正确:
6.1:配置正确的检查结果:
[root@elk-server2 conf.d]# /etc/init.d/logstash configtest
Configuration OK
6.2:语法错误的显示结果:
[root@elk-server2 tianqi]# /etc/init.d/logstash configtest
The given configuration is invalid. Reason: Expected one of #, {, } at line 17, column 53 (byte 355) after output {
    if  [type] == "nginx3"  {
        elasticsearch {
                hosts => ["192.168.0.251:9200"]
                index => "logstash-newsmart-nginx3-" {:level=>:fatal}  #会指明语法错误的具体地方
三:tomcat日志:
1、tomcat日志默认不是json格式的,但是logstash分析的时候就没有key和valus了,所以我们可以将tomcat日志的格式定义为json的格式:
directory="logs"  prefix="localhost_access_log." suffix=".log"
     pattern="{"client":"%h",  "client user":"%l",   "authenticated":"%u",   "access time":"%t",     "method":"%r",   "status":"%s",  "send bytes":"%b",  "Query?string":"%q",  "partner":"%{Referer}i",  "Agent version":"%{User-Agent}i"}"/>
2、取到的日志结果为:
{"client":"180.95.129.206", "client user":"-", "authenticated":"-", "access time":"[20/Apr/2016:03:47:40 +0000]", "method":"GET /image/android_logo.png HTTP/1.1", "status":"200", "send bytes":"1915", "Query string":"", "partner":"http://mobile.weathercn.com/index.do?id=101160101&partner=1000001003", "Agent version":"Mozilla/5.0 (Linux; U; Android 5.1.1; zh-cn; NX510J Build/LMY47V) AppleWebKit/537.36 (KHTML, like Gecko)Version/4.0 Chrome/37.0.0.0 MQQBrowser/6.6 Mobile Safari/537.36"}
3、在线验证是否合法的json格式:
地址:http://www.bejson.com/,将完整的一行日志复制到验证框,然后点验证即可:结果如下

四:nginx 日志格式处理:
1、编辑nginx.conf配置文件,自定义一个日志格式:
[root@node5 ~]# vim /etc/nginx/nginx.conf

2、添加内容如下:
    log_format logstash_json '{"@timestamp":"$time_iso8601",'
        '"host":"$server_addr",'
        '"clientip":"$remote_addr",'
        '"size":$body_bytes_sent,'
        '"responsetime":$request_time,'
        '"upstreamtime":"$upstream_response_time",'
        '"upstreamhost":"$upstream_addr",'
        '"http_host":"$host",'
        '"url":"$uri",'
        '"domain":"$host",'
        '"xff":"$http_x_forwarded_for",'
        '"referer":"$http_referer",'
        '"agent":"$http_user_agent",'
        '"status":"$status"}';
3、编辑主机配置:
[root@node5 ~]# grep -v "#"  /etc/nginx/conf.d/locathost.conf  | grep -v "^$"
server {
    listen       9009; #监听的端口
    server_name  www.a.com;  #主机名

    access_log  /var/log/nginx/json.access.log  logstash_json;  #定义日志路径为/var/log/nginx/json.access.log,并引用在主配置文件nginx.conf中定义的json日志格式
    include /etc/nginx/default.d/*.conf;
    location / {
        root   /usr/share/nginx/html;
        index  index.html index.htm;
    }
    error_page  404              /404.html;
    location = /404.html {
        root   /usr/share/nginx/html;
    }
    error_page   500 502 503 504  /50x.html;
    location = /50x.html {
        root   /usr/share/nginx/html;
    }
}
4、重启nginx,查看日志格式是json格式了:
[root@node5 ~]# tail /var/log/nginx/json.access.log
{"@timestamp":"2016-04-12T22:15:19+08:00","host":"192.168.10.205","clientip":"192.168.10.205","size":3698,"responsetime":0.000,"upstreamtime":"-","upstreamhost":"-","http_host":"192.168.10.205","url":"/index.html","domain":"192.168.10.205","xff":"-","referer":"-","agent":"ApacheBench/2.3","status":"200"}
{"@timestamp":"2016-04-12T22:15:19+08:00","host":"192.168.10.205","clientip":"192.168.10.205","size":3698,"responsetime":0.000,"upstreamtime":"-","upstreamhost":"-","http_host":"192.168.10.205","url":"/index.html","domain":"192.168.10.205","xff":"-","referer":"-","agent":"ApacheBench/2.3","status":"200"}
{"@timestamp":"2016-04-12T22:15:19+08:00","host":"192.168.10.205","clientip":"192.168.10.205","size":3698,"responsetime":0.000,"upstreamtime":"-","upstreamhost":"-","http_host":"192.168.10.205","url":"/index.html","domain":"192.168.10.205","xff":"-","referer":"-","agent":"ApacheBench/2.3","status":"200"}
{"@timestamp":"2016-04-12T22:15:19+08:00","host":"192.168.10.205","clientip":"192.168.10.205","size":3698,"responsetime":0.000,"upstreamtime":"-","upstreamhost":"-","http_host":"192.168.10.205","url":"/index.html","domain":"192.168.10.205","xff":"-","referer":"-","agent":"ApacheBench/2.3","status":"200"}
{"@timestamp":"2016-04-12T22:15:19+08:00","host":"192.168.10.205","clientip":"192.168.10.205","size":3698,"responsetime":0.001,"upstreamtime":"-","upstreamhost":"-","http_host":"192.168.10.205","url":"/index.html","domain":"192.168.10.205","xff":"-","referer":"-","agent":"ApacheBench/2.3","status":"200"}
{"@timestamp":"2016-04-12T22:15:19+08:00","host":"192.168.10.205","clientip":"192.168.10.205","size":3698,"responsetime":0.000,"upstreamtime":"-","upstreamhost":"-","http_host":"192.168.10.205","url":"/index.html","domain":"192.168.10.205","xff":"-","referer":"-","agent":"ApacheBench/2.3","status":"200"}
5、在线效验日志格式是否正确:
效验地址:http://www.bejson.com/

五:画图功能
在地图显示IP的访问次数统计:
1、在elasticsearch服务器用户家目录下载一个Filebeat 模板:
cd ~
curl -O https://gist.githubusercontent.com/thisismitch/3429023e8438cc25b86c/raw/d8c479e2a1adcea8b1fe86570e42abab0f10f364/filebeat-index-template.json #这是一个模板文件
2、加载模板:
[root@elk-server1 ~]# curl -XPUT 'http://192.168.0.251:9200/_template/filebeat?pretty' -d@filebeat-index-template.json  #是elasticsearch监听的IP地址
{
  "acknowledged" : true  #一定要返回true才表示成功
}
3、下载GeoIP 数据库文件:
[root@elk-server1 ~]# cd /etc/logstash/
[root@elk-server1 logstash]# curl -O "http://geolite.maxmind.com/download/geoip/database/GeoLiteCity.dat.gz"
[root@elk-server1 logstash]# gunzip GeoLiteCity.dat.gz
[root@elk-server1 logstash]# ls
conf.d  GeoLiteCity.dat  #确认文件存在
4、配置logstash使用GeoIP:
[root@elk-server1 logstash]# vim /etc/logstash/conf.d/11-mobile-tomcat-access.conf #logstash的文件配置要以.conf结尾
input {
        redis {
                data_type => "list"
                key => "mobile-tomcat-access-log"
                host => "192.168.0.251"
                port => "6379"
                db => "0"
                codec  => "json"
        }
}

#input部分为从redis读取客户端logstash分析提交后的访问日志

filter {
        if [type] == "mobile-tomcat" {
        geoip {
                source => "client"  #client 是客户端logstash收集日志时定义的公网IP的key名称,一定要和实际名称一致,因为要通过此名称获取到其对于的ip地址
                target => "geoip"
                database => "/etc/logstash/GeoLiteCity.dat"
                add_field => [ "[geoip][coordinates]", "%{[geoip][longitude]}" ]
                add_field => [ "[geoip][coordinates]", "%{[geoip][latitude]}"  ]
        }
    mutate {
      convert => [ "[geoip][coordinates]", "float"]
        }
    }
}


output {
        if [type] == "mobile-tomcat" {
        elasticsearch {
                hosts => ["192.168.0.251"]
                manage_template => true
                index => "logstash-mobile-tomcat-access-log-%{+YYYY.MM.dd}" #index的名称一定要是logstash开头的,否则会在使用地图的时候出现geoIP type无法找找到的类似错误
                flush_size => 2000
                idle_flush_time => 10
                }
        }
}
5、在kibana界面添加新的索引,然后visualize---->Tile map---->From a new search---->Select a index patterm--->选择之前的index---->Geo coordinates,然后点绿色的运行按钮即可:
