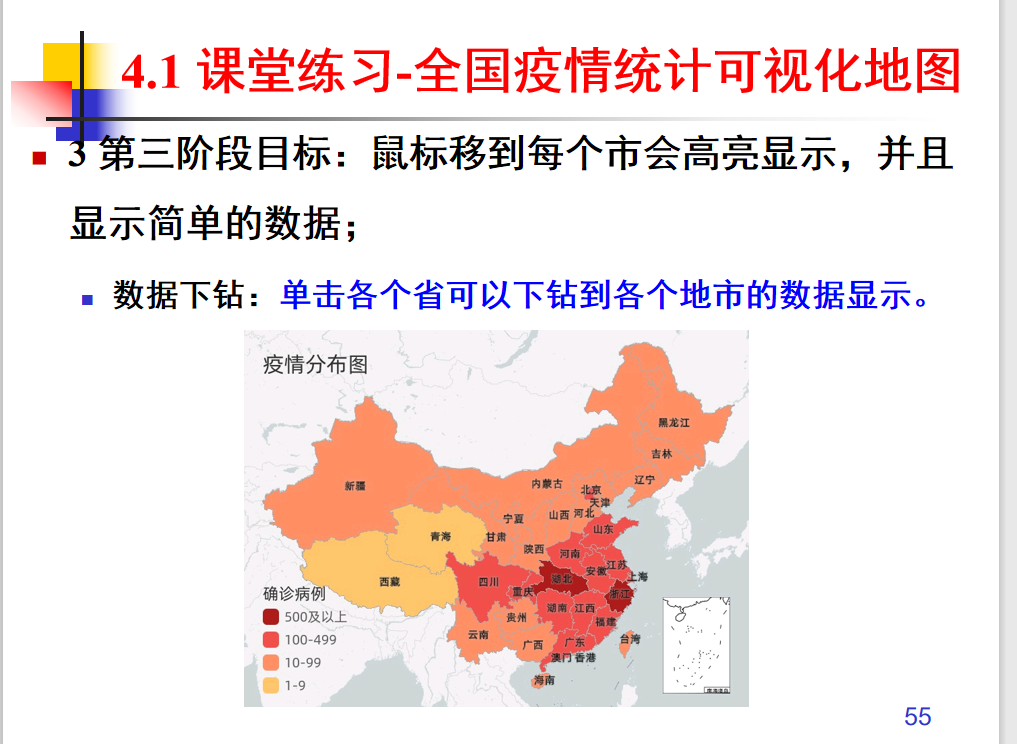
该阶段只要处理中国地图跳转到省市的地图即可。
在上一阶段的全国地图中加入点击事件的代码:
//点击事件,根据点击某个省份进入省份地图
     chart.on('click', function (params) {
         var url = "${pageContext.request.contextPath }/toChildMap?area=" + params.name;
         window.location.href = url;
     });
这里我要跳转到一个servlet,然后再跳转到子地图(其实直接跳转子地图也可以)
servlet代码:
package web;

import java.io.IOException;
import javax.servlet.ServletException;
import javax.servlet.annotation.WebServlet;
import javax.servlet.http.HttpServlet;
import javax.servlet.http.HttpServletRequest;
import javax.servlet.http.HttpServletResponse;

/**
 * Servlet implementation class toChildMap
 */
@WebServlet("/toChildMap")
public class toChildMap extends HttpServlet {

    protected void doGet(HttpServletRequest request, HttpServletResponse response) throws ServletException, IOException {

        request.setCharacterEncoding("UTF-8");
        response.setContentType("text/html;charset=utf-8");
        String area = request.getParameter("area");
        request.setAttribute("area", area);
        request.getRequestDispatcher("/childmap.jsp").forward(request, response);
    }

    /**
     * @see HttpServlet#doPost(HttpServletRequest request, HttpServletResponse response)
     */
    protected void doPost(HttpServletRequest request, HttpServletResponse response) throws ServletException, IOException {
        // TODO Auto-generated method stub
        doGet(request, response);
    }

}
接下来是省份地图的显示:
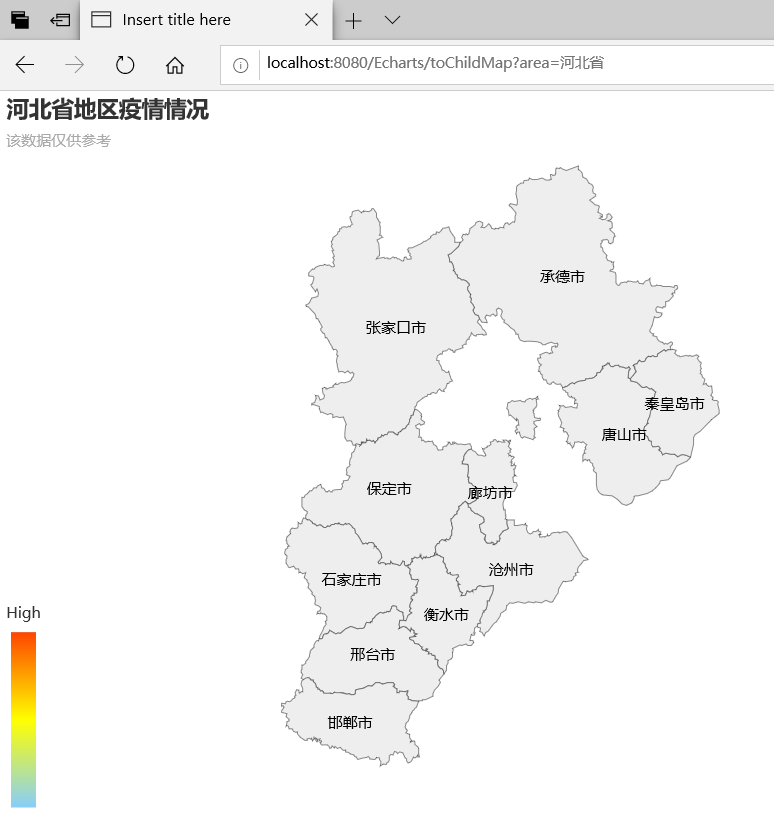
<%@ page language="java" contentType="text/html; charset=UTF-8"
    pageEncoding="UTF-8"%>
<%@ taglib uri="http://java.sun.com/jsp/jstl/core"  prefix="c"%>
<!DOCTYPE html>
<html>
<head>
<meta charset="UTF-8">
<meta http-equiv="X-UA-Compatible" content="IE=edge">
<meta name="viewport" content="width=device-width, initial-scale=1">
<link rel="stylesheet" type="text/css" href="${pageContext.request.contextPath }/css/bootstrap.min.css" />
<script src="${pageContext.request.contextPath }/js/jquery-1.8.3.js"></script>
<script src="${pageContext.request.contextPath }/js/bootstrap.min.js"></script>
<script src="${pageContext.request.contextPath }/js/echarts.min.js"></script>
<script src="${pageContext.request.contextPath }/js/china.js"></script>
<title>Insert title here</title>

</head>
<body>

    <!-- 为ECharts准备一个具备大小(宽高)的Dom -->
        <div id="main" style=" 800px;;height:600px;"></div>

<script>
var myChart = echarts.init(document.getElementById('main'));
myChart.showLoading();
var area = "${area}";
$.get("${pageContext.request.contextPath }/js/mapjson/"+ area +".json", function (geoJson) {

    myChart.hideLoading();

    echarts.registerMap(area, geoJson);

    myChart.setOption(option = {
        title: {
            text: area + '地区疫情情况',
            subtext: '该数据仅供参考',
        },
        tooltip: {
            trigger: 'item',
            formatter: '{b}<br/>{c} (p / km2)'
        },
        toolbox: {
            show: true,
            orient: 'vertical',
            left: 'right',
            top: 'center',
            feature: {
                dataView: {readOnly: false},
                restore: {},
                saveAsImage: {}
            }
        },
        visualMap: {
            min: 800,
            max: 50000,
            text: ['High', 'Low'],
            inRange: {
                color: ['lightskyblue', 'yellow', 'orangered']
            }
        },
        series: [
            {
                name: '香港18区人口密度',
                type: 'map',
                mapType: area, // 自定义扩展图表类型
                label: {
                    show: true
                }
            }
        ]
    });
});


//异步加载数据
$.ajax({
   type : "post",
   async : true,            //异步请求(同步请求将会锁住浏览器,用户其他操作必须等待请求完成才可以执行)
   url : "${pageContext.request.contextPath }/getMapData",    //请求发送到TestServlet处
   success : function(resultJson) {
       var result= jQuery.parseJSON(resultJson);
       //请求成功时执行该函数内容,result即为服务器返回的json对象
       if (result) {
               chart.setOption({        //加载数据图表
                  series: [{
                      data: result
                  }]
              });

       }
  },
   error : function(errorMsg) {
       //请求失败时执行该函数
   alert("图表请求数据失败!");
   }
});


</script>


</body>
</html>
这里只需要按照官网给出的例子手动注册地图即可,关键的是需要有省份地图的json,此处我便是通过传递过来的省份名称来找json并注册地图从而显示的。
json:

(这里只修改了几个)
数据的展示便和全国疫情地图的信息一样,异步获取下数据即可。
跳转后: