Tomcat性能指标:吞吐量、响应时间、错误数、线程池、CPU 、内存等。使用jmeter进行压测,然后观察相关指标
使用命令查看相关指标:
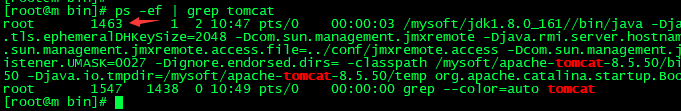
查看tomcat进程pid,ps -ef | grep tomcat :
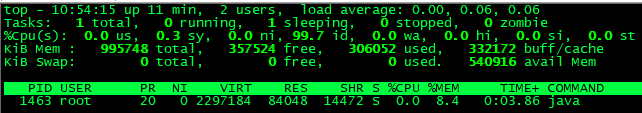
查看进程的cpu和内存,top -p pid :
使用工具查看相关指标:jconsole、jvisualvm、arthas、psi-probe等
优化思路:
1.conf/server.xml核心组件:
- Server:官网描述 :Server interface which is rarely customized by users. 【pass】
- Service:官网描述 :The Service element is rarely customized by users. 【pass】
- Connector:官网描述 :Creating a customized connector is a significant effort. 【 need 】
- Engine:官网描述 :The Engine interface may be implemented to supply custom Engines, though this is uncommon.【pass】
- Host:官网描述 :Users rarely create custom Hosts because the StandardHost implementation provides significant additional functionality. 【pass】
- Context:官网描述 :The Context interface may be implemented to create custom Contexts, but this is rarely the case because the StandardContext provides significant additional functionality. 【 maybe 】Context既然代表的是web应用,是和我们比较接近的,这块我们考虑对其适当的优化
结论(conclusion):Connector and Context。
2.conf/server.xml非核心组件:
官网 :https://tomcat.apache.org/tomcat-8.0-doc/config/index.html
Listener:
Listener(即监听器)定义的组件,可以在特定事件发生时执行特定的操作;被监听的事件通常是Tomcat的启动和停止。删掉没用的。
<Listener className="org.apache.catalina.core.AprLifecycleListener" SSLEngine="on" />
<!--监听内存溢出-->
<Listener className="org.apache.catalina.core.JreMemoryLeakPreventionListener" />
<Listener className="org.apache.catalina.mbeans.GlobalResourcesLifecycleListener" />
<Listener className="org.apache.catalina.core.ThreadLocalLeakPreventionListener" />
Global Resources
GlobalNamingResources元素定义了全局资源,通过配置可以看出,该配置是通过读取$TOMCAT_HOME/conf/tomcat-users.xml实现的。
<GlobalNamingResources>
  <Resource name="UserDatabase" auth="Container"
  type="org.apache.catalina.UserDatabase"
  description="User database that can be updated and saved"
  factory="org.apache.catalina.users.MemoryUserDatabaseFactory"
  pathname="conf/tomcat-users.xml" />
</GlobalNamingResources>
Valve:
访问日志处理所有的例子。
<Valve className="org.apache.catalina.valves.AccessLogValve" directory="logs"
prefix="localhost_access_log" suffix=".txt"
pattern="%h %l %u %t "%r" %s %b" />
Realm:
Realm,可以把它理解成“域”;Realm提供了一种用户密码与web应用的映射关系,从而达到角色安全管理的作用。在本例中,Realm的配置使用name为UserDatabase的资源实现。而该资源在Server元素中使用GlobalNamingResources配置
<Realm className="org.apache.catalina.realm.LockOutRealm">
  <!-- This Realm uses the UserDatabase configured in the global JNDI
  resources under the key "UserDatabase". Any edits
  that are performed against this UserDatabase are immediately
  available for use by the Realm. -->
  <Realm className="org.apache.catalina.realm.UserDatabaseRealm"
  resourceName="UserDatabase"/>
</Realm>
3.conf/web.xml:
全局的web.xml文件有些标签用不到的,可以删除掉。
4.JVM层面:
因为Tomcat运行起来本身就是一个Java进程,所以这块可以参照JVM部分的优化思路。
5.减少 web.xml/server.xml 中标签,最终观察tomcat启动日志[时间/内容],线程开销,内存大小,GC等。DefaultServlet,JspServlet等。
6.调整优化 server.xml 中 Connector 标签:
<Connector port="8080" protocol="HTTP/1.1"
       connectionTimeout="20000"
       redirectPort="8443" />
对于protocol="HTTP/1.1",查看源码setProtocol(protocol)因为配置文件中传入的是HTTP/1.1,发现这里调用的是Http11NioProtocol,也就是说明tomcat8.0.x中默认使用的是NIO使用同样的方式看tomcat7和tomcat8.5,你会发现tomcat7默认使用的是BIO,tomcat8.5默认使用的是NIO,tomcat8.0中默认使用的是NIO.可以调整IO模型。
org.apache.coyote.http11.Http11Protocol - blocking Java connector
org.apache.coyote.http11.Http11NioProtocol - non blocking Java NIO connector
org.apache.coyote.http11.Http11Nio2Protocol - non blocking Java NIO2 connector
org.apache.coyote.http11.Http11AprProtocol - the APR/native connector.
executor属性:最佳线程数公式 :((线程等待时间+线程cpu时间)/线程cpu时间) * cpu数量,默认的可以查看StandardExecutor类
如果静态服务器为nginx,不是apache,可以将一下这个标签删除
<Connector port="8009" protocol="AJP/1.3" redirectPort="8443" />
可以把其他没用的标签删掉,节约资源
设置一些属性:
- acceptCount: :达到最大连接数之后,等待队列中还能放多少连接,超过即拒绝,配置太大也没有意义。
- maxConnections:达到这个值之后,将继续接受连接,但是不处理,能继续接受多少根据acceptCount的值。BIO建议设置为maxThreads,NIO/NIO2建议设置10000 ,参考源码AbstractEndpoint.maxConnections默认就是这个值,APR:819。
- maxThreads:最大工作线程数,也就是用来处理request请求的,默认是200,如果自己配了executor,并且和Connector有关联了,则之前默认的200就会被忽略,取决于CPU的配置。监控中就可以看到所有的工作线程是什么状态,通过监控就能知道开启多少个线程合适
- minSpareThreads:最小空闲线程数
- enableLookups:设置为false
7.Host标签:autoDeploy :Tomcat运行时,要用一个线程拿出来进行检查,生产环境之下一定要改成false
8.Context标签:reloadable:false,reloadable:如果这个属性设为true,tomcat服务器在运行状态下会监视在WEB-INF/classes和WEB-INF/lib目录下class文件的改动,如果监测到有class文件被更新的,服务器会自动重新加载Web应用。在开发阶段将reloadable属性设为true,有助于调试servlet和其它的class文件,但这样用加重服务器运行负荷,建议在Web应用的发存阶段将reloadable设为false。
9.启动速度优化:删除没用的web应用,因为tomcat启动每次都会部署这些应用。关闭WebSocket:websocket-api.jar和tomcat-websocket.jar。随机数优化:设置JVM参数:-Djava.security.egd=file:/dev/./urandom。多个线程启动Web应用:
<Host startStopThreads="0">
</Host>
其他方面的优化:Connector配置压缩属性compression="500",文件大于500bytes才会压缩。数据库优化,减少对数据库访问等待的时间,可以从数据库的层面进行优化,或者加缓存等等各种方案。开启浏览器缓存,nginx静态资源部署
常见问题排查:
CPU使用率过高,可能原因GC频繁或者创建了很多业务线程。排查:哪些线程比较消耗CPU,或者多线程上下文频繁切换。解决思路:top -H -p pid 查看某个Java进程各个线程使用CPU的情况,找到哪个线程占用CPU比较高。jstack pid 打印出线程信息,定位到上述的线程名称
拒绝连接:
- java.net.BindException: Address already in use: JVM_Bind,端口被占用,可以使用netstat -an 查看端口占用情况,关闭对应的进程或者tomcat换端口
- java.net.ConnectException: Connection refused: connect:ping一下服务端的IP,可能服务端机器有问题
- java.net.SocketException: Too many open files:可能在高并发的情况下,创建的Socket过多,文件句柄不够用了,可以关闭无用的句柄,如果都有用,可以增加文件句柄数:ulimit -n 10000