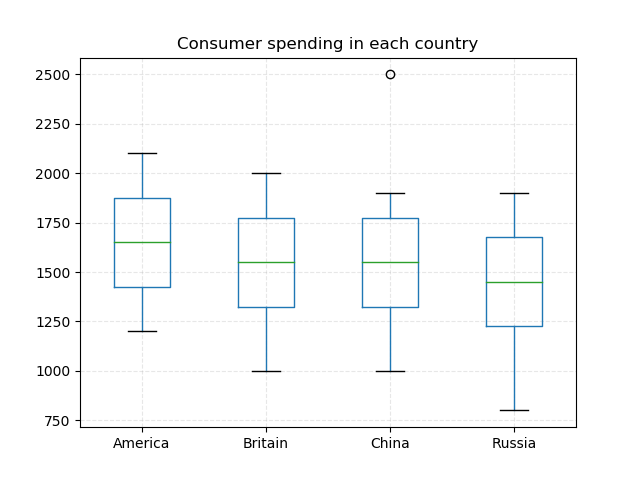
各国家用户消费分布
import numpy as np
import pandas as pd
import matplotlib.pyplot as plt

data = {
    'China': [1000, 1200, 1300, 1400, 1500, 1600, 1700, 1800, 1900, 2500],
    'America': [1200, 1300, 1400, 1500, 1600, 1700, 1800, 1900, 2000, 2100],
    'Britain': [1000, 1200, 1300, 1400, 1500, 1600, 1700, 1800, 1900, 2000],
    "Russia": [800, 1000, 1200, 1300, 1400, 1500, 1600, 1700, 1800, 1900]
}
df = pd.DataFrame(data)

# df.plot.box(title="Consumer spending in each country", vert=False)
df.plot.box(title="Consumer spending in each country")

plt.grid(linestyle="--", alpha=0.3)
plt.show()
import numpy as np
import pandas as pd
import matplotlib.pyplot as plt
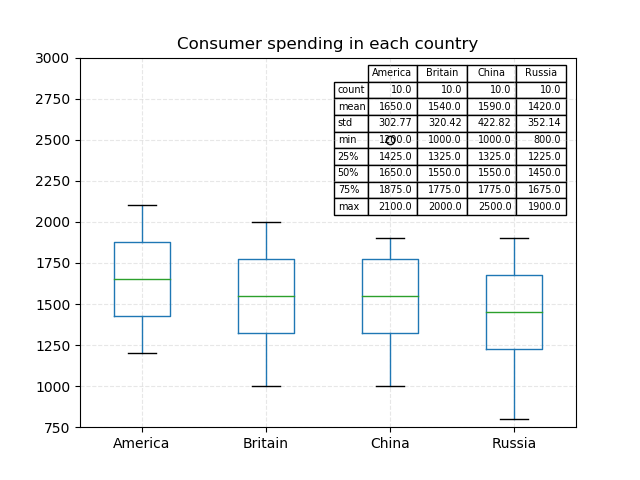
data = {
'China': [1000, 1200, 1300, 1400, 1500, 1600, 1700, 1800, 1900, 2500],
'America': [1200, 1300, 1400, 1500, 1600, 1700, 1800, 1900, 2000, 2100],
'Britain': [1000, 1200, 1300, 1400, 1500, 1600, 1700, 1800, 1900, 2000],
"Russia": [800, 1000, 1200, 1300, 1400, 1500, 1600, 1700, 1800, 1900]
}
df = pd.DataFrame(data)
from pandas.plotting import table
fig, ax = plt.subplots(1, 1)
table(ax, np.round(df.describe(), 2),
loc='upper right',
colWidths=[0.1, 0.1, 0.1, 0.1]
)
# df.plot.box(title="Consumer spending in each country", vert=False)
df.plot.box(title="Consumer spending in each country",
ax=ax,
ylim=(750, 3000))
plt.grid(linestyle="--", alpha=0.3)
plt.show()
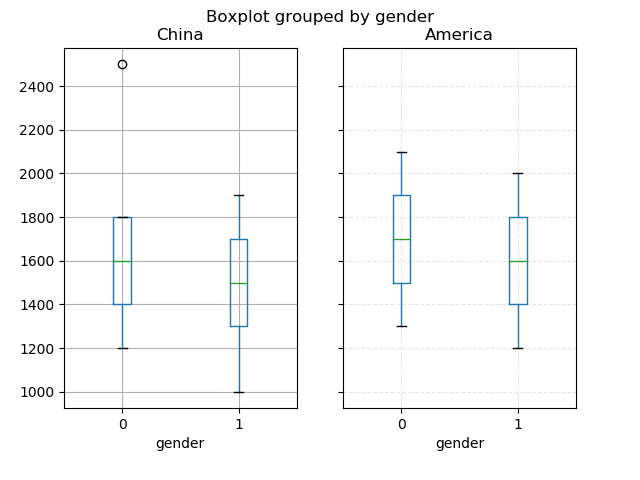
import numpy as np
import pandas as pd
import matplotlib.pyplot as plt

data = {"gender": [1, 0, 1, 0, 1, 0, 1, 0, 1, 0],
        'China': [1000, 1200, 1300, 1400, 1500, 1600, 1700, 1800, 1900, 2500],
        'America': [1200, 1300, 1400, 1500, 1600, 1700, 1800, 1900, 2000, 2100]
        }
df = pd.DataFrame(data)

# df.boxplot(column=["China", "America"], by="gender",vert=False)
df.boxplot(column=["China", "America"], by="gender")

plt.grid(linestyle="--", alpha=0.3)
plt.show()