jmeter图形监控扩展
插件下载:http://jmeter-plugins.org/downloads/all/
插件下载:http://jmeter-plugins.org/downloads/all/

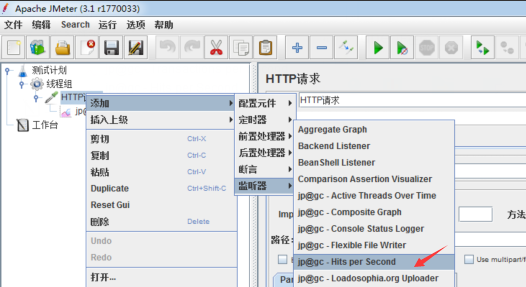
(1)首先将jmeterPluging.jar包复制到jmeter的lib目录下面的ext目录下面,然后重新启动
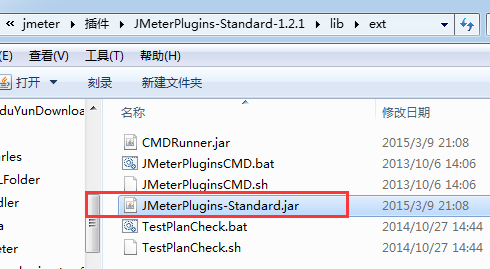
重启启动后在监听器中会多一些jp开头的选项

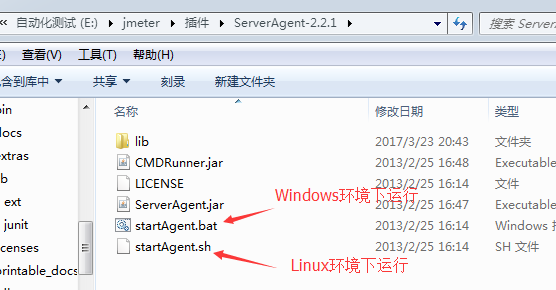
(2)jmeter将serverAgent目录及下面的文件复制到我们测试的服务器上,然后点击打开serverAgent.bat,它默认端口4444(特别是对于perfmon metrics collector测试一定要启动serverAgent)
双击运行即可
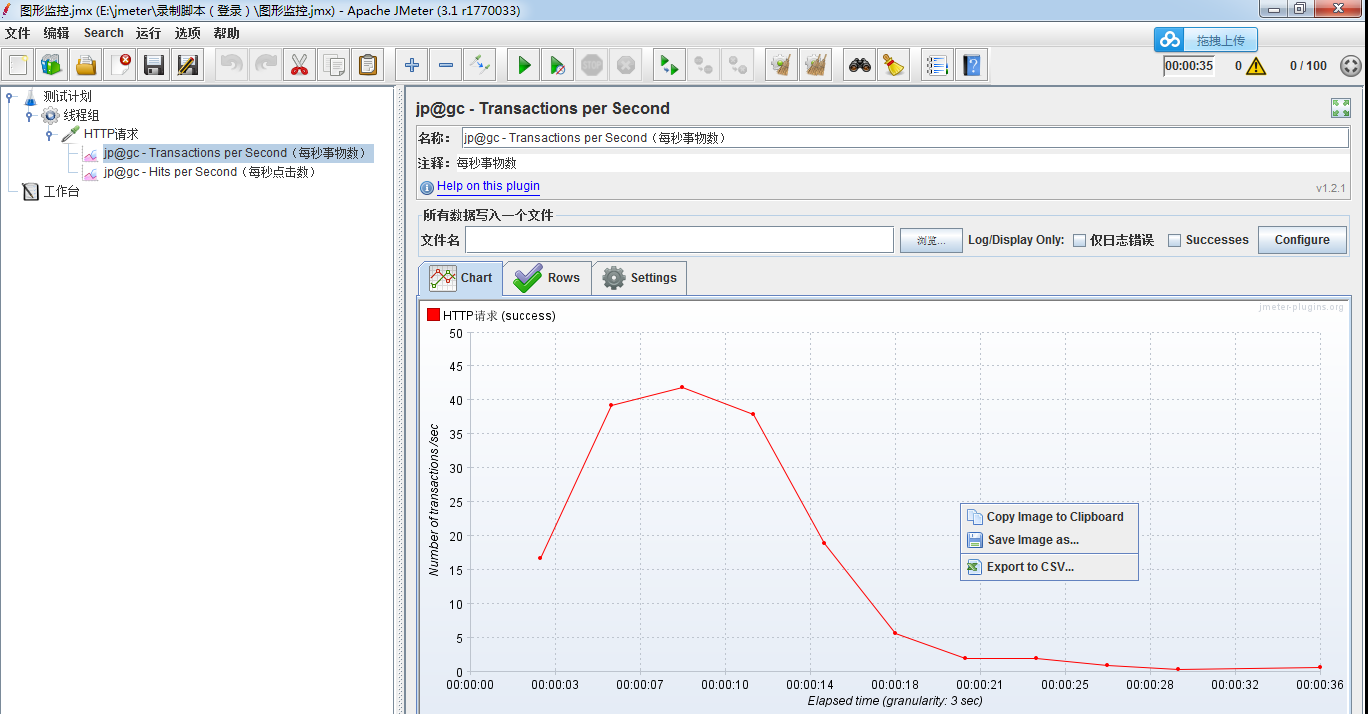
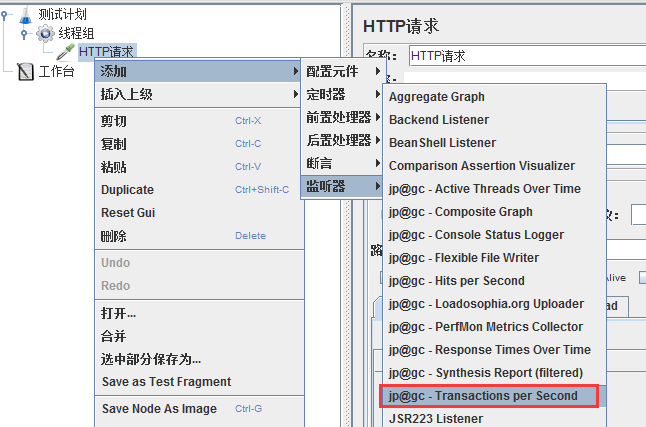
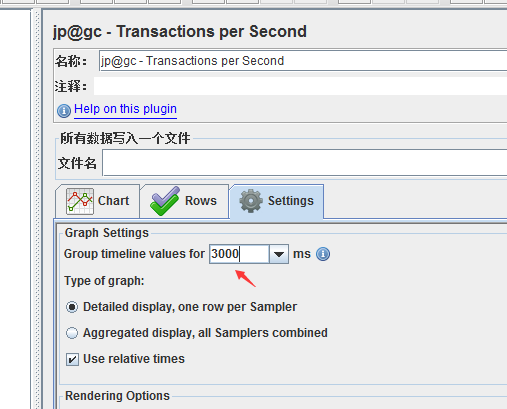
在http请求中添加jp@gc-Transactions per Second
设置数据采取时间3秒
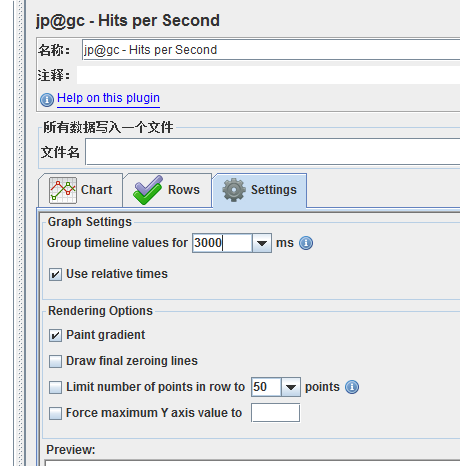
再添加jp@gc-hits per second
设置数据采取时间3秒
设置线程组数据后点击运行
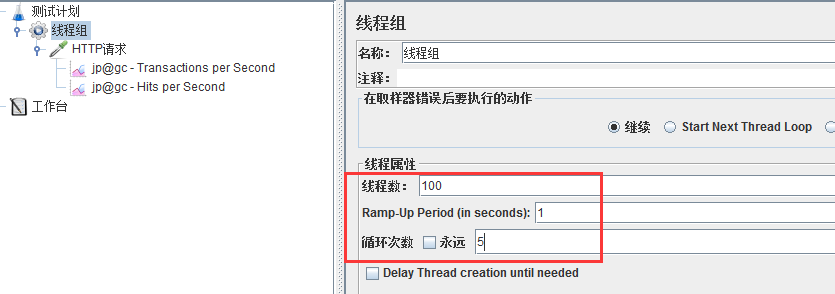
运行后可以监控到运行的图形