原文地址 https://www.peganza.com/delphi-and-outputdebugstring.html
Ever wanted to monitor your Delphi application in realtime, and be able to view log messages? Of course you can always run in full debug mode inside RAD Studio IDE. Another way is to output log messages, for example to a text file. You can also use the OutputDebugString function.
An advantage of this approach is that it impacts your application as little as possible. You don't have to care about file handling. Just call a function.
The OutputDebugString function is defined in the Win32 API, in the RTL unit Winapi.Windows.
You simply call it from your code like this:
|
1
2
3
4
5
6
7
8
9
10
11
|
..uses Winapi.Windows;..var Msg : string; begin OutputDebugString('This is my message'); Msg := 'This is another log message'; OutputDebugString(PChar(Msg)); .. |
If you call OutputDebugString repeatedly or in a loop, it may cause some performance overhead. So make sure that calls to OutputDebugString are not included in your release version. To avoid it, you can use a conditional compilation directive, like:
|
1
2
3
4
5
|
.. (*$IFDEF ODS*) OutputDebugString('This is my message'); (*$ENDIF*).. |
Only activate the compilation directive "ODS" when you want to log messages this way. Also, consider creating a wrapper function for the call to OutputDebugString, so your code will be easier to read and maintain. Something like this:
|
1
2
3
4
5
6
|
procedure DebugODS(const Msg : string);begin (*$IFDEF ODS*) OutputDebugString(PChar(Msg)); (*$ENDIF*)end; |
If you run from within RAD Studio IDE, the log messages will be displayed in the output window.
But if you run standalone, a good possibility is to use the free DebugView application (dbgview.exe) available from SysInternals (Microsoft). Information from their web page:
DebugView is an application that lets you monitor debug output on your local system, or any computer on the network that you can reach via TCP/IP. It is capable of displaying both kernel-mode and Win32 debug output, so you don't need a debugger to catch the debug output your applications or device drivers generate, nor do you need to modify your applications or drivers to use non-standard debug output APIs.
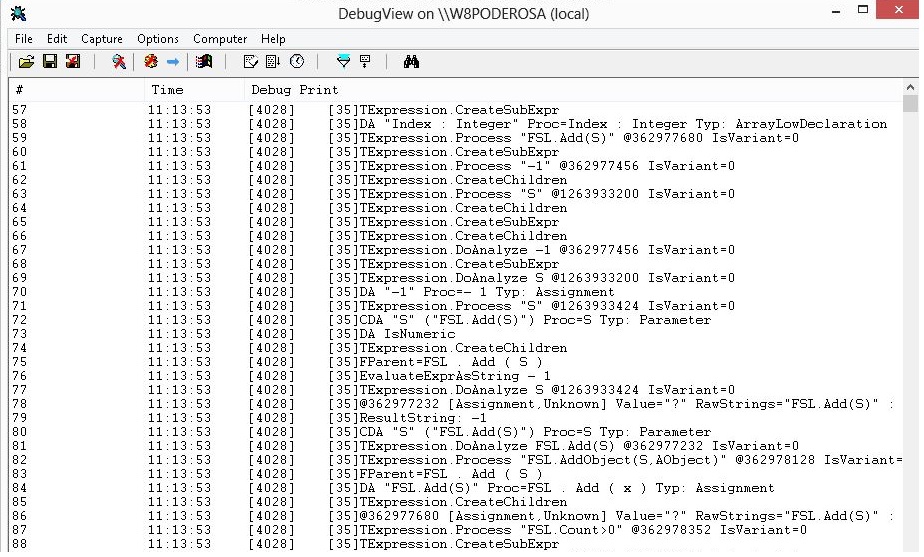
The image above shows some sample debug output from our Pascal Analyzer application.
As you see in the screenshot, messages are prefixed with a timestamp and a process ID. Read more about DebugView and download it here.