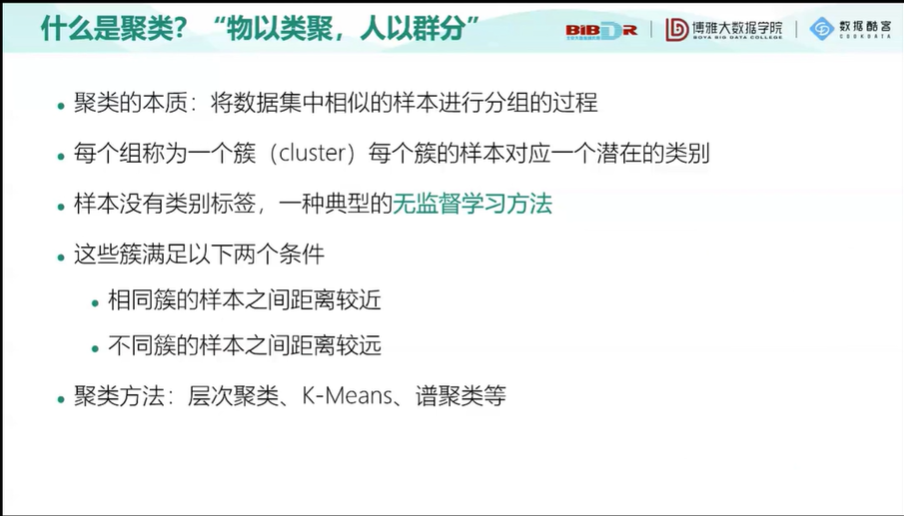
聚类

K-Means模型

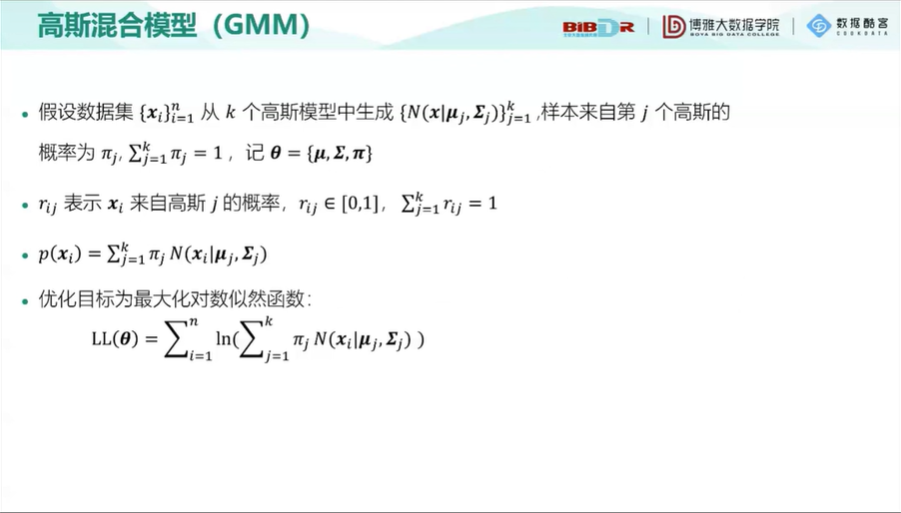
高斯混合模型

K-Means 的 Python 实现及在图像分割和新闻聚类中的应用
import pandas as pd
import numpy as np
import matplotlib.pyplot as plt
def point_dist(x,c):
    return np.linalg.norm(x-c)
def k_means(X, k):
    C = X.sample(k).values  # 从数据集随机选择 K 个样本作为初始化的类中心,k 行 d 列
    X_labels = np.zeros(len(X))  # 记录样本的类别
    error = 10e10  # 停止迭代的阈值
    while (error > 1e-6):
        D = np.zeros((len(X), k))  # 样本到每一个中心的距离,n 行 k 列
        for i in range(k):
            D[:, i] = np.sqrt(np.sum(np.square(X - C[i, :]), axis=1))
        labels = np.argmin(D, axis=1)
        C_pre = C

        temp_C = X.groupby(labels).mean()  # 更新样本均值,即类中心
        C = np.zeros((k, X.shape[1]))
        for i in temp_C.index:
            C[i, :] = temp_C.loc[i, :].values

        if C.shape == C_pre.shape:
            error = np.linalg.norm(C_pre - C)  # 计算error
        else:
            print(C.shape, C_pre.shape)
    return labels, C
color_dict = {0:"#E4007F",1:"#007979",2:"blue",3:"orange"} #洋红,深绿,蓝色,橘色
from sklearn import datasets
X, y = datasets.make_blobs(n_samples=1000, n_features=2, cluster_std = 1.5,centers=4,random_state=999)
X_df = pd.DataFrame(X,columns=["x1","x2"])
labels,centers= k_means(X_df,4)
fig, ax = plt.subplots(figsize=(8, 8)) #设置图片大小
for i in range(len(centers)):
    ax.scatter(X_df[labels == i]["x1"],X_df[labels == i]["x2"],color=color_dict[i],s=50,alpha=0.4)
    ax.scatter(centers[int(i),0],centers[int(i),1],color="r",s=100,marker="+")
plt.xlabel("$x_1$")
plt.ylabel("$x_2$")
plt.show()
def k_means_steps(X, k):
    # 初始化 K 个中心,从原始数据中选择样本
    # ********#
    samples_list = []  # 记录每一个中间迭代中每一类样本
    centers_list = []  # 记录每一个中间迭代中每一类样本中心
    # ********#
    C = X.sample(k).values
    labels = np.zeros(len(X))  # 样本的类别
    error = 10e10
    while (error > 1e-6):
        D = np.zeros((len(X), k))  # 样本到每一个中心的距离
        for i in range(k):
            D[:, i] = np.sqrt(np.sum(np.square(X - C[i, :]), axis=1))
        labels = np.argmin(D, axis=1)
        C_pre = C
        C = X.groupby(labels).mean().values  # 更新样本均值,即类中心
        # ********# 记录当前迭代地每一类的样本集合和中心
        samples, centers2 = [], []
        for i in range(k):
            samples.append(X[labels == i])
            centers2.append(C[i, :])

        samples_list.append(samples)
        centers_list.append(centers2)
        # ********#
        if C.shape == C_pre.shape:
            error = np.linalg.norm(C_pre - C)  # 计算error
        else:
            print(C.shape, C_pre.shape)
    return labels, C, samples_list, centers_list  # ********# 返回最终的聚类结果,聚类中心,每一步的聚类结果和聚类中心
