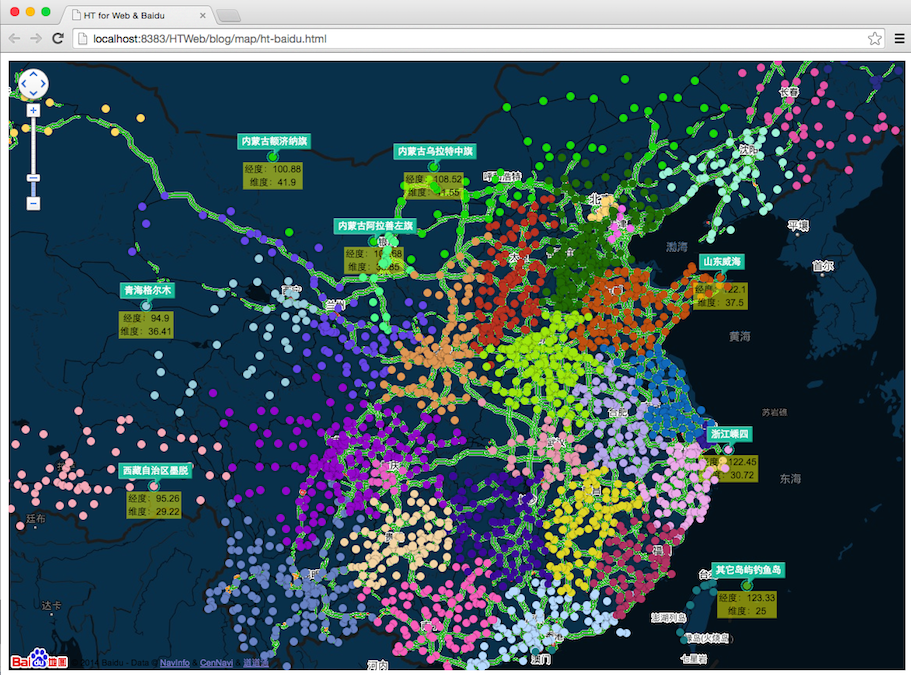
在《HT for Web整合OpenLayers实现GIS地图应用》篇中介绍了HT for Web与OpenLayers的整合,不少朋友反应国内用得比较多的还是百度地图,虽然HT整合百度地图原理与OpenLayers一致,但不同GIS引擎客户端结合代码细节还是有不少差异,自定义地图风格更是完全不一样,为此我再开篇介绍下HT与百度地图整合的方案,这次我们将改进以前的例子,除了代表城市的拓扑节点外,再增加连线连接省会和城市,实现网络拓扑链路的流动效果。
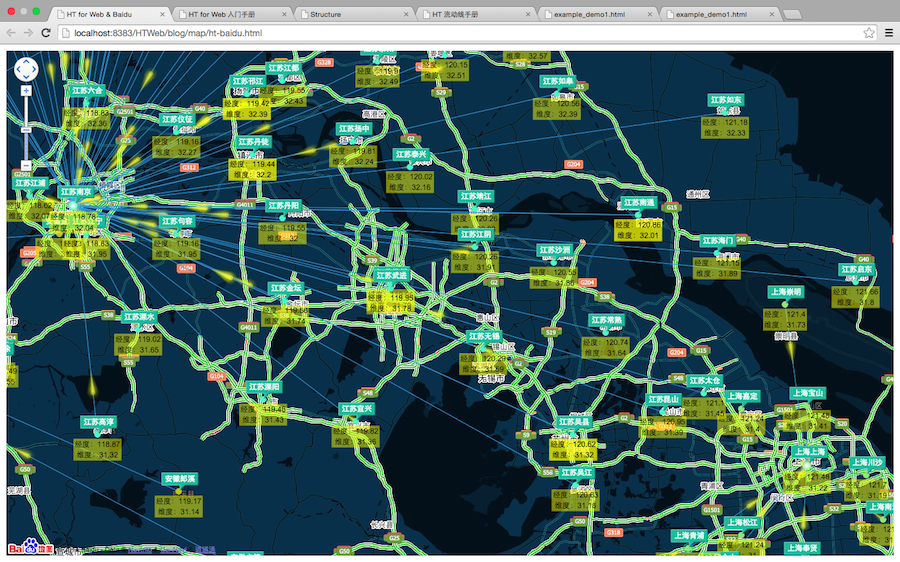
百度地图有多种客户端SDK,我们这里用的自然是JavaScript版的API,百度地图的2.0版增加了不少新功能,例如可以自定义地图样式模板,本例中我们特意设置成style:’midnight’的深色背景风格。插入map的位置与OpenLayers也不一样,通过mapDiv.firstChild.firstChild.appendChild(view);插入,zIndex这些属性都还好不需要设置。
坐标转换方面从经纬度转换成平面坐标是map.pointToPixel函数,通过node.setPosition(map.pointToPixel(new BMap.Point(lon, lat)));可设置ht.Node对应的平面逻辑坐标,通过map.pixelToPoint(new BMap.Pixel(x,y))可将平面坐标转换成经纬度坐标,我们在监听节点图元被拖拽结束的endMove需要重新计算当前位置的经纬度时用到。
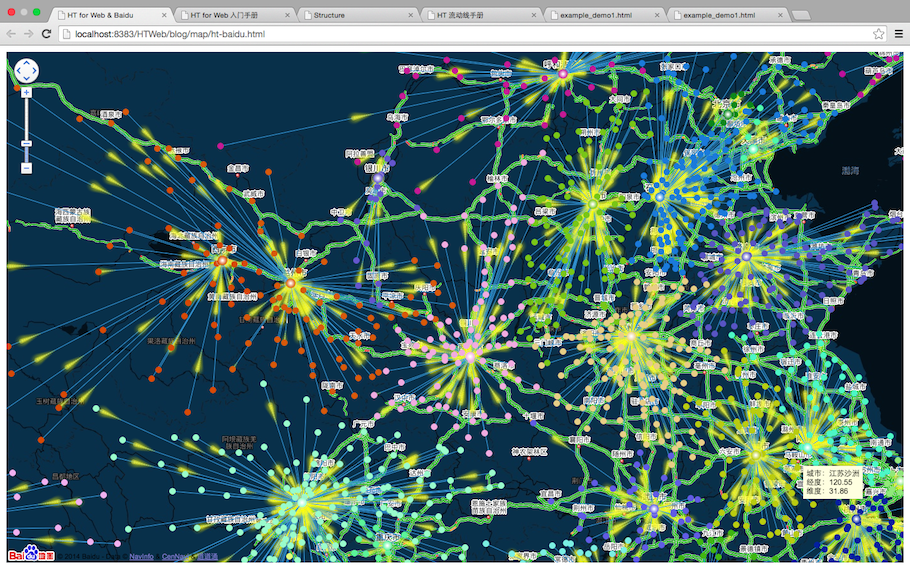
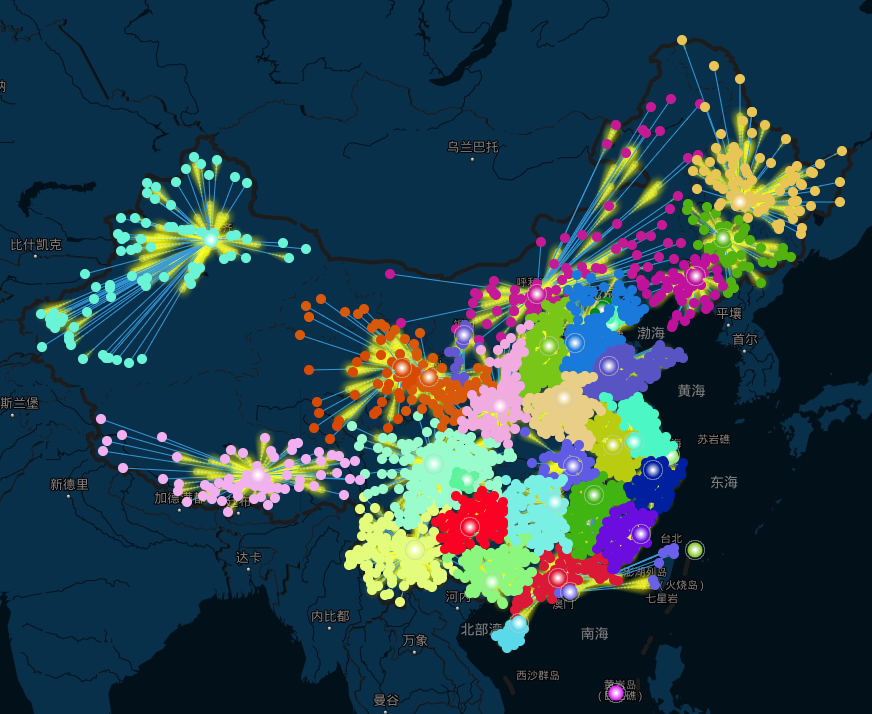
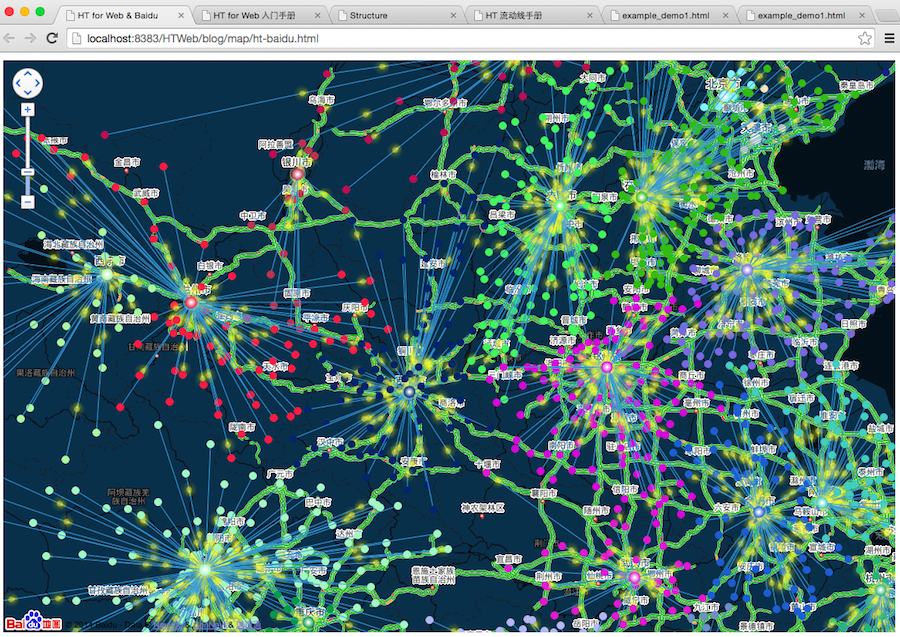
地图数据方面每个省的省会城市都是第一个出现,因此我们构建了size大一点的带渐进色的图元代表省会城市,其他城市构建时同时构建ht.Edge的连线与省会节点连接,同时引入HT的ht-flow.js插件,只需要graphView.enableFlow(60);一句话就可以启动流动连线功能,每条edge连线还可以有很多flow.*相关的流动参考可控制流动效果,这里的简单例子我们不需要做定制,保持HT默认的流动参数就足够酷了。
另外通过graphView.setLayers(['edgeLayer', 'nodeLayer']);我们为拓扑设置了两个层,node.setLayer(‘nodeLayer’);和edge.setLayer(‘edgeLayer’)使得图元节点全部呈现于连线之上,从这个细节大家可以发现,以前需要在GIS的SDK扩展的功能也可以通过在HT的GraphView实现,地图仅仅是作为背景,业务逻辑代码完全在更灵活强大的HT模型中进行。
其他方面细节还由监听map的缩放等操作对拓扑图元重新定位,以及监听交互决定GraphView还是Map进行控制等都与以前的文章类似,这里就不再介绍了,以下为操作视频、抓图和源代码供大家参考,这样的结合可完美的将百度地图丰富的地图数据信息,与HT强大的逻辑拓扑功能相结合,否则光靠百度地图SDK的API的扩展方式,用户只能做些简单的效果,例如连线流动等效果都远不如HT这样一行代码就搞定来的容易。http://v.youku.com/v_show/id_XODQxMDcwNjQ0.html
var dataModel = new ht.DataModel();
var graphView = new ht.graph.GraphView(dataModel);
var map = null;

function init() {
    map = new BMap.Map("map");
    var point = new BMap.Point(116.404, 39.915);
    map.addTileLayer(new BMap.TrafficLayer());
    map.centerAndZoom(point, 4);
    map.enableScrollWheelZoom();
    map.addControl(new BMap.NavigationControl());

    map.setMapStyle({
        features: ["road", "building","water","land"],
        style:'midnight'
    });

    var view = graphView.getView();
    view.className = 'graphView';
    var mapDiv = document.getElementById('map');
    mapDiv.firstChild.firstChild.appendChild(view);

    map.addEventListener('movestart', function(e){
       view.style.opacity = 0;
    });
    map.addEventListener('moveend', function(e){
       view.style.opacity = 1;
       resetPosition();
    });
    map.addEventListener('dragstart', function(e){
       view.style.opacity = 0;
    });
    map.addEventListener('dragend', function(e){
       view.style.opacity = 1;
       resetPosition();
    });
    map.addEventListener('zoomstart', function(e){
        view.style.opacity = 0;
    });
    map.addEventListener('zoomend', function(e){
        view.style.opacity = 1;
        resetPosition();
    });

    graphView.setLayers(['edgeLayer', 'nodeLayer']);
    graphView.enableFlow(60);
    graphView.enableToolTip();
    graphView.getToolTip = function(event){
        var data = this.getDataAt(event);
        if(data instanceof ht.Node){
            return '城市:' + data.s('note') + '
经度:' + data.lonLat.lng + '
维度:' + data.lonLat.lat;
        }
        return null;
    };
    graphView.isVisible = function(data){
        return map.getZoom() > 1 || this.isSelected(data);
    };
    graphView.isNoteVisible = function(data){
        return map.getZoom() > 8 || this.isSelected(data);
    };
    graphView.getLabel = function(data){
        if(data instanceof ht.Node){
            return '经度:' + data.lonLat.lng + '
维度:' + data.lonLat.lat;
        }
    };
    graphView.isLabelVisible = function(data){
        return map.getZoom() > 9 || this.isSelected(data);
    };

    graphView.mi(function(e){
        if(e.kind === 'endMove'){
            graphView.sm().each(function(data){
                if(data instanceof ht.Node){
                   var position = data.getPosition(),
                       x = position.x + graphView.tx(),
                       y = position.y + graphView.ty();
                   data.lonLat = map.pixelToPoint(new BMap.Pixel(x,y));
                }
            });
        }
    });

    graphView.setAutoScrollZone(-1);
    graphView.handleScroll = function(){};
    graphView.handlePinch = function(){};

    var handleClick = function(e){
        var data = graphView.getDataAt(e);
        if(data){
            e.stopPropagation();
        }
        else if(e.metaKey || e.ctrlKey){
            e.stopPropagation();
        }
    };
    graphView.getView().addEventListener('click', handleClick, false);
    graphView.getView().addEventListener('dblclick', handleClick, false);
    graphView.getView().addEventListener(ht.Default.isTouchable ? 'touchstart' : 'mousedown', handleClick, false);

    window.addEventListener("resize", function(e) {
        graphView.invalidate();
    }, false);

    var color = randomColor(),
        province = null;
    lines = china.split('
');
    for(var i=0; i<lines.length; i++) {
        line = lines[i].trim();
        if(line.indexOf('【') === 0){
            color = randomColor();
            province = null;
        }else{
            var ss = line.split(' ');
            if(ss.length === 3){
                var node = createNode(parseFloat(ss[1].substr(3)), parseFloat(ss[2].substr(3)), ss[0].substr(3), color);
                if(province){
                    var edge = new ht.Edge(province, node);
                    edge.s({
                        'edge.center': true,
                        'edge.width': 1,
                        'flow': true
                    });
                    edge.setLayer('edgeLayer');
                    dataModel.add(edge);
                }else{
                    province = node;
                    node.s({
                        'shape.gradient': 'radial.center',
                        'border.type': 'circle',
                        'border.width': 1,
                        'border.color': 'rgba(200, 200, 200, 0.5)'
                    });
                    node.setSize(15, 15);
                }
            }
        }
    }

}

function createNode(lon, lat, name, color){
    var node = new ht.Node();
    node.s({
        'shape': 'circle',
        'shape.background': color,
        'note': name,
        'label.background': 'rgba(255, 255, 0, 0.5)',
        'select.type': 'circle'
    });
    node.setLayer('nodeLayer');
    node.setSize(10, 10);
    var lonLat = new BMap.Point(lon, lat);
    node.setPosition(map.pointToPixel(lonLat));
    node.lonLat = lonLat;
    graphView.dm().add(node);
    return node;
}

function resetPosition(e){
    graphView.tx(0);
    graphView.ty(0);
    dataModel.each(function(data){
        if(data instanceof ht.Node){
            var lonLat = data.lonLat,
                position = map.pointToPixel(lonLat);
            data.setPosition(position.x,position.y);
        }
    });
}