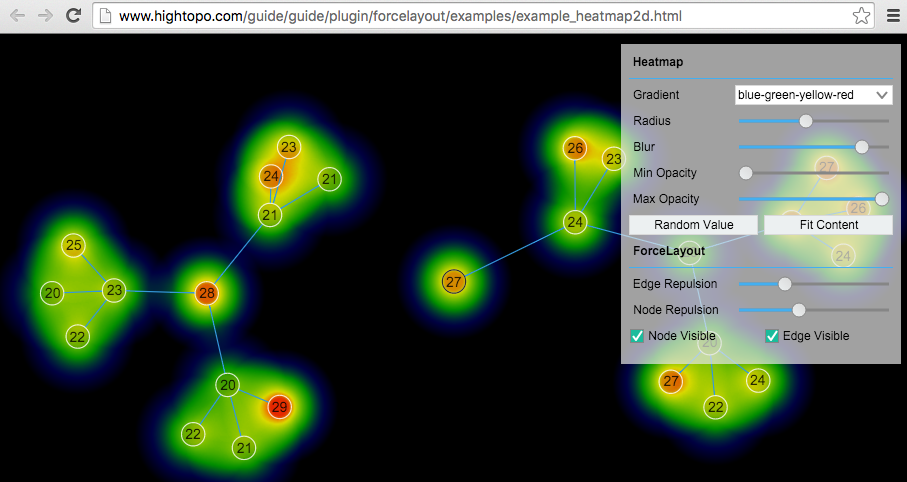
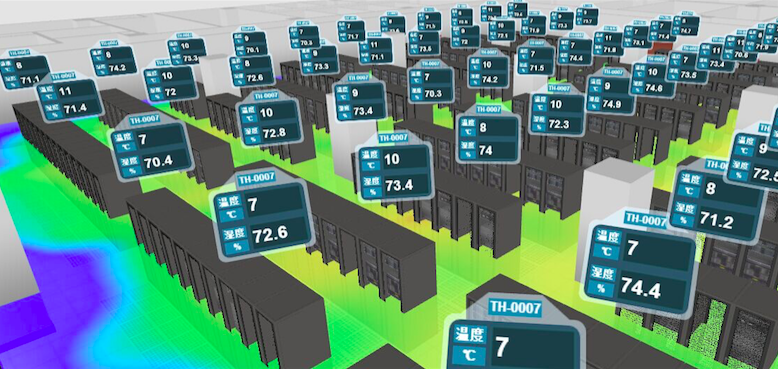
Heatmap热图通过众多数据点信息,汇聚成直观可视化颜色效果,热图已广泛被应用于气象预报、医疗成像、机房温度监控等行业,甚至应用于竞技体育领域的数据分析。
http://www.hightopo.com/guide/guide/plugin/forcelayout/examples/example_heatmap2d.html

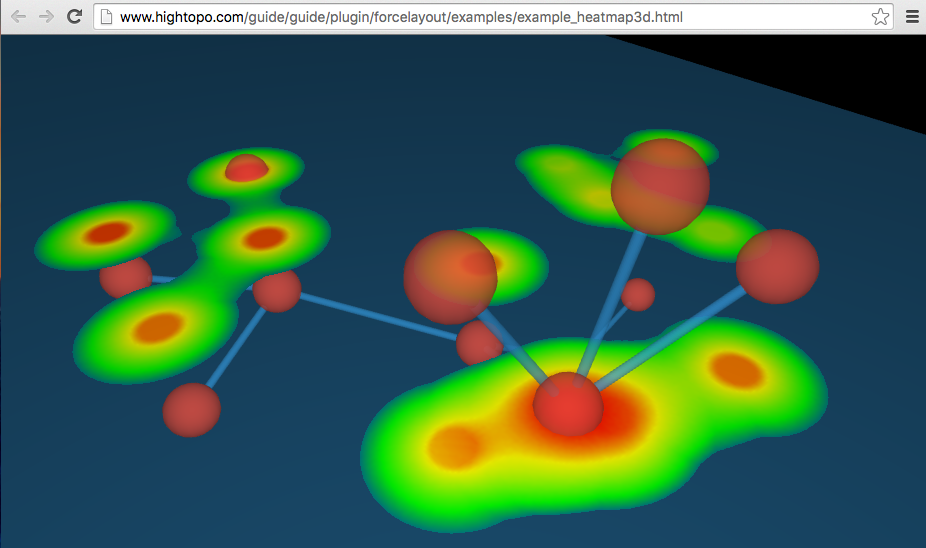
http://www.hightopo.com/guide/guide/plugin/forcelayout/examples/example_heatmap3d.html

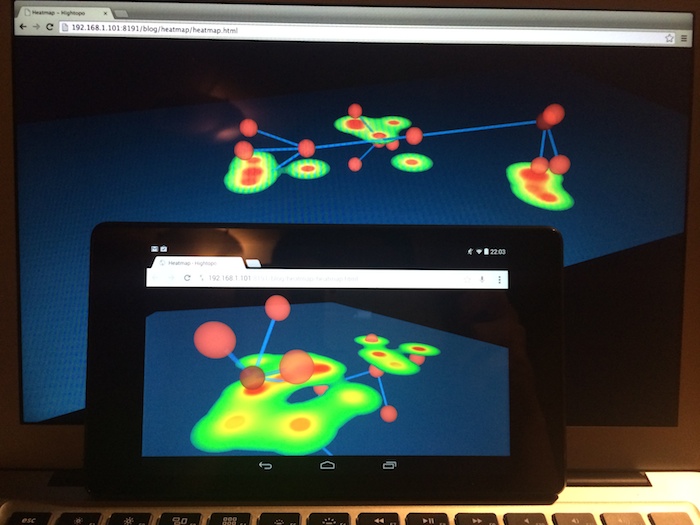
已有众多文章分享了生成Heatmap热图原理,可参考《How to make heat maps》和《How to make heat maps in Flex》,本文将介绍基于HTML5技术的实现方式,主要基于Cavans和WebGL这两种HTML5的2D和3D技术的应用,先上最终例子实现的界面效果和操作视频:
实现Heatmap的开源js库比较出名的就是 heatmapjs ,该框架发展了2年多,作者Patrick Wied最近决定在保持开源的基础上,提供有偿的商业支持服务,这是好事,地球上绝大部分开源项目作者搞个barely可用的初级版本后,就多年不见更新了,而真正能实际上线使用的产品哪有不需要持续完善、增强可扩展性以及提供特殊定制服务的,考虑到作者这两年已无偿投了这么多(Over the last 2 years, I devoted more than 500 hours of work to improving heatmap.js to make it a truly great library. ),希望此文也能帮作者在国内起点宣传作用。
heatmapjs 采用的Canvas的2D绘制方式实现,这种基于CPU的绘制方式对于几百几千的点还凑合,但如果需要实时运算成千上万节点效果的,还是得依靠并发性更强大的GPU方式,采用HTML5的话只能是WebGL方案,还好Florian Boesch在《High Performance JS heatmaps》博客中提供了基于WebGL实现的heatmap方式,并将其开源在https://github.com/pyalot/webgl-heatmap 上,这两个开源库质量都还不错,一个基于Canvas实现,一个基于WebGL实现,后者性能高点,但需要支持WebGL的浏览器,heatmapjs 的文档例子比较全面,但两者接口都非常简单易学,代码也都就几百行,你完全可以根据项目情况选择甚至进行代码改造优化。
回到我们要实现的例子,我将采用heatmapjs在内存中实时运算出热图,结合hightopo(http://www.hightopo.com/)的HT for Web的3D引擎,以一堆节点连线关系的3D的网络拓扑图,其中节点代表热源,其越接近地面则地面温度越高,这样每个节点的xz面坐标信息作为要传入给heatmapjs的点xy二维坐标信息,三维节点的elevation也就是y轴信息,则作为离地面的距离信息,距离越大转成要传入heatmapjs的value值越小,最后启动HT for Web的三维拓扑自动布局弹力算法,这样可直观的观察图元节点在不同的空间位置动态变化时地板的温度热图变化效果。
代码核心就在重载forceLayout.onRelaxed函数,在每次自动布局过程将所有热源节点的信息构建成heatmap需要的数据,同时通过ht.Default.setImage(‘hm-bottom’, heatmap._renderer.canvas);将热图的canvas注册成HT的图片,而floor的地板图元绑定了注册的’hm-bottom’图片,这样就实现了内存绘制canvas,然后通过HT for Web的3D引擎将Cavnas作为贴图信息动态呈现到3D场景的效果。
整个实现代码如下不到百行,你也可以采用https://github.com/pyalot/webgl-heatmap 的WebGL方式来实现,这样就是3D到2D再到3D的有趣过程,这就是HTML5技术可无缝融合各种方案的魅力!

 1 MAX = 500;
 2 WIDTH = 1024;
 3 HEIGHT = 512;
 4 function init() {
 5     dataModel = new ht.DataModel();
 6     g3d = new ht.graph3d.Graph3dView(dataModel);
 7     g3d.getMoveMode = function(e){ return 'xyz'; };
 8     view = g3d.getView();
 9     view.className = 'main';
10     document.body.appendChild(view);
11     window.addEventListener('resize', function (e) { g3d.invalidate(); }, false);
12     heatmap = h337.create({  WIDTH, height: HEIGHT });
13     ht.Default.setImage('hm-bottom', heatmap._renderer.canvas);
14     var floor = new ht.Node();
15     floor.s3(WIDTH, 1, HEIGHT);
16     floor.s({
17         '3d.selectable': false,
18         'layoutable': false,
19         'all.visible': false,
20         'top.visible': true,
21         'top.image': 'hm-bottom',
22         'top.reverse.flip': true,
23         'bottom.visible': true,
24         'bottom.transparent': true,
25         'bottom.opacity': 0.5,
26         'bottom.reverse.flip': true
27     });
28     dataModel.add(floor);
29     var root = createNode();
30     for (var i = 0; i < 3; i++) {
31         var iNode = createNode();
32         createEdge(root, iNode);
33         for (var j = 0; j < 3; j++) {
34             var jNode = createNode();
35             createEdge(iNode, jNode);
36         }
37     }
38     forceLayout = new ht.layout.Force3dLayout(g3d);
39     forceLayout.start();
40     forceLayout.onRelaxed = function(){
41         var points = [];
42         dataModel.each(function(data){
43             if(data instanceof ht.Node && data !== floor){
44                 var p3 = data.p3();
45                 if(p3[1] > MAX){
46                     p3[1] = MAX;
47                     data.setElevation(MAX);
48                 }
49                 else if(p3[1] < -MAX){
50                     p3[1] = -MAX;
51                     data.setElevation(-MAX);
52                 }
53                 points.push({
54                     x: p3[0] + WIDTH/2,
55                     y: p3[2] + HEIGHT/2,
56                     value: MAX - Math.abs(p3[1])
57                 });
58             }
59         });
60         heatmap.setData({data: points, min: 0, max: MAX});
61     };
62 }
63 function createNode(){
64     var node = new ht.Node();
65     node.s({
66         'shape3d': 'sphere',
67         'shape3d.color': '#E74C3C',
68         'shape3d.opacity': 0.8,
69         'shape3d.transparent': true,
70         'shape3d.reverse.cull': true
71     });
72     node.s3(20, 20, 20);
73     dataModel.add(node);
74     return node;
75 }
76 function createEdge(sourceNode, targetNode){
77     var edge = new ht.Edge(sourceNode, targetNode);
78     edge.s({
79         'edge.width': 3,
80         'edge.offset': 10,
81         'shape3d': 'cylinder',
82         'shape3d.opacity': 0.7,
83         'shape3d.transparent': true,
84         'shape3d.reverse.cull': true
85     });
86     dataModel.add(edge);
87     return edge;
88 }
