JMH使用说明
一、概述
JMH,即Java Microbenchmark Harness,是专门用于代码微基准测试的工具套件。何谓Micro Benchmark呢?简单的来说就是基于方法层面的基准测试,精度可以达到微秒级。当你定位到热点方法,希望进一步优化方法性能的时候,就可以使用JMH对优化的结果进行量化的分析。和其他竞品相比——如果有的话,JMH最有特色的地方就是,它是由Oracle内部实现JIT的那拨人开发的,对于JIT以及JVM所谓的“profile guided optimization”对基准测试准确性的影响可谓心知肚明(smile)
JMH比较典型的应用场景有:
- 想准确的知道某个方法需要执行多长时间,以及执行时间和输入之间的相关性;
- 对比接口不同实现在给定条件下的吞吐量;
- 查看多少百分比的请求在多长时间内完成;
二、第一个例子
接下来,我们看看如何使用JMH。
要使用JMH,首先需要准备好Maven环境,JMH的源代码以及官方提供的Sample就是使用Maven进行项目管理的,github上也有使用gradle的例子可自行搜索参考。使用mvn命令行创建一个JMH工程:
mvn archetype:generate
          -DinteractiveMode=false
          -DarchetypeGroupId=org.openjdk.jmh
          -DarchetypeArtifactId=jmh-java-benchmark-archetype
          -DgroupId=co.speedar.infra
          -DartifactId=jmh-test
          -Dversion=1.0
如果要在现有Maven项目中使用JMH,只需要把生成出来的两个依赖以及shade插件拷贝到项目的pom中即可:
    <dependency>
        <groupId>org.openjdk.jmh</groupId>
        <artifactId>jmh-core</artifactId>
        <version>0.7.1</version>
    </dependency>
    <dependency>
        <groupId>org.openjdk.jmh</groupId>
        <artifactId>jmh-generator-annprocess</artifactId>
        <version>0.7.1</version>
        <scope>provided</scope>
    </dependency>
...
    <plugin>
        <groupId>org.apache.maven.plugins</groupId>
        <artifactId>maven-shade-plugin</artifactId>
        <version>2.0</version>
        <executions>
            <execution>
                <phase>package</phase>
                <goals>
                    <goal>shade</goal>
                </goals>
                <configuration>
                    <finalName>microbenchmarks</finalName>
                    <transformers>
                        <transformer implementation="org.apache.maven.plugins.shade.resource.ManifestResourceTransformer">
                            <mainClass>org.openjdk.jmh.Main</mainClass>
                        </transformer>
                    </transformers>
                </configuration>
            </execution>
        </executions>
    </plugin>
然后,就可以着手写第一个JMH例子了:
package co.speedar.infra.test;
import java.util.concurrent.TimeUnit;
import org.openjdk.jmh.annotations.Benchmark;
import org.openjdk.jmh.annotations.BenchmarkMode;
import org.openjdk.jmh.annotations.Mode;
import org.openjdk.jmh.annotations.OutputTimeUnit;
import org.openjdk.jmh.annotations.Scope;
import org.openjdk.jmh.annotations.State;
import org.openjdk.jmh.runner.Runner;
import org.openjdk.jmh.runner.RunnerException;
import org.openjdk.jmh.runner.options.Options;
import org.openjdk.jmh.runner.options.OptionsBuilder;
import org.slf4j.Logger;
import org.slf4j.LoggerFactory;
@BenchmarkMode(Mode.AverageTime) // 测试方法平均执行时间
@OutputTimeUnit(TimeUnit.MICROSECONDS) // 输出结果的时间粒度为微秒
@State(Scope.Thread) // 每个测试线程一个实例
public class FirstBenchMark {
    private static Logger log = LoggerFactory.getLogger(FirstBenchMark.class);
    @Benchmark
    public String stringConcat() {
        String a = "a";
        String b = "b";
        String c = "c";
        String s = a + b + c;
        log.debug(s);
        return s;
    }
    public static void main(String[] args) throws RunnerException {
        // 使用一个单独进程执行测试,执行5遍warmup,然后执行5遍测试
        Options opt = new OptionsBuilder().include(FirstBenchMark.class.getSimpleName()).forks(1).warmupIterations(5)
                .measurementIterations(5).build();
        new Runner(opt).run();
    }
}在上面的测试代码中,加了几个类注解以及一个方法注解,在main方法中指明了测试的一些选项,然后使用JMH提供的Runner执行测试。在注释中提供了大致的讲解,具体的选项说明后边再详述。接下来我们直接跑起来这个测试看看结果如何。执行测试,可能会遇到报错:Exception in thread "main" java.lang.RuntimeException: ERROR: Unable to find the resource: /META-INF/BenchmarkList
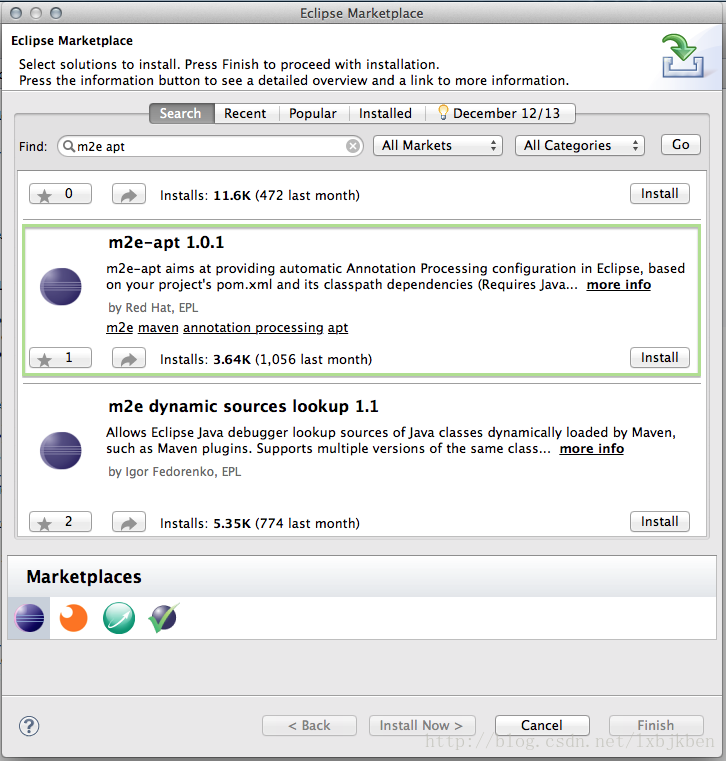
解决方法:
- 先执行mvn clean install然后再在ide中执行main方法;
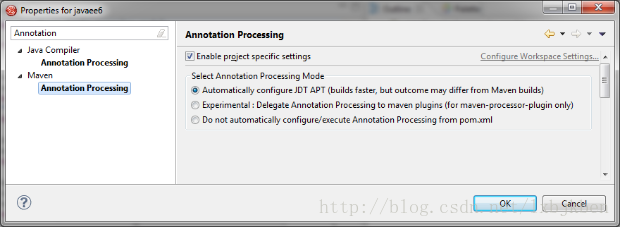
-
或者在eclipse中安装m2e-apt插件,然后启用Automatically configure JDT APT选项;
然后,就可以愉快地看到测试结果如下:
# JMH 1.14.1 (released 525 days ago, please consider updating!)
# VM version: JDK 1.8.0_91, VM 25.91-b14
# VM invoker: /Library/Java/JavaVirtualMachines/jdk1.8.0_91.jdk/Contents/Home/jre/bin/java
# VM options: -Dfile.encoding=UTF-8
# Warmup: 5 iterations, 1 s each
# Measurement: 5 iterations, 1 s each
# Timeout: 10 min per iteration
# Threads: 1 thread, will synchronize iterations
# Benchmark mode: Average time, time/op
# Benchmark: co.speedar.infra.test.FirstBenchMark.stringConcat
# Run progress: 0.00% complete, ETA 00:00:10
# Fork: 1 of 1
# Warmup Iteration   1: 0.009 us/op
# Warmup Iteration   2: 0.011 us/op
# Warmup Iteration   3: 0.007 us/op
# Warmup Iteration   4: 0.006 us/op
# Warmup Iteration   5: 0.006 us/op
Iteration   1: 0.006 us/op
Iteration   2: 0.005 us/op
Iteration   3: 0.005 us/op
Iteration   4: 0.006 us/op
Iteration   5: 0.006 us/op

Result "stringConcat":
  0.006 ±(99.9%) 0.001 us/op [Average]
  (min, avg, max) = (0.005, 0.006, 0.006), stdev = 0.001
  CI (99.9%): [0.005, 0.006] (assumes normal distribution)

# Run complete. Total time: 00:00:10
Benchmark                    Mode  Cnt  Score    Error  Units
FirstBenchMark.stringConcat  avgt    5  0.006 ±  0.001  us/op
测试结果表明,被测试方法平均耗时为0.006微秒,误差为±0.001微秒。
三、详细说明
3.1 基本概念
首先看看JMH的几个基本概念:
-
Mode
Mode 表示 JMH 进行 Benchmark 时所使用的模式。通常是测量的维度不同,或是测量的方式不同。目前 JMH 共有四种模式:-
Throughput: 整体吞吐量,例如“1秒内可以执行多少次调用”。
-
AverageTime: 调用的平均时间,例如“每次调用平均耗时xxx毫秒”。
-
SampleTime: 随机取样,最后输出取样结果的分布,例如“99%的调用在xxx毫秒以内,99.99%的调用在xxx毫秒以内”
-
SingleShotTime: 以上模式都是默认一次 iteration 是 1s,唯有 SingleShotTime 是只运行一次。往往同时把 warmup 次数设为0,用于测试冷启动时的性能。
-
-
Iteration
Iteration 是 JMH 进行测试的最小单位。在大部分模式下,一次 iteration 代表的是一秒,JMH 会在这一秒内不断调用需要 benchmark 的方法,然后根据模式对其采样,计算吞吐量,计算平均执行时间等。 -
Warmup
Warmup 是指在实际进行 benchmark 前先进行预热的行为。为什么需要预热?因为 JVM 的 JIT 机制的存在,如果某个函数被调用多次之后,JVM 会尝试将其编译成为机器码从而提高执行速度。为了让 benchmark 的结果更加接近真实情况就需要进行预热。
3.2 注解与选项
3.2.1 常用注解说明
-
@BenchmarkMode
对应Mode选项,可用于类或者方法上, 需要注意的是,这个注解的value是一个数组,可以把几种Mode集合在一起执行,还可以设置为Mode.All,即全部执行一遍。 -
@State
类注解,JMH测试类必须使用@State注解,State定义了一个类实例的生命周期,可以类比Spring Bean的Scope。由于JMH允许多线程同时执行测试,不同的选项含义如下:-
Scope.Thread:默认的State,每个测试线程分配一个实例;
-
Scope.Benchmark:所有测试线程共享一个实例,用于测试有状态实例在多线程共享下的性能;
-
Scope.Group:每个线程组共享一个实例;
-
-
@OutputTimeUnit
benchmark 结果所使用的时间单位,可用于类或者方法注解,使用java.util.concurrent.TimeUnit中的标准时间单位。 -
@Benchmark
方法注解,表示该方法是需要进行 benchmark 的对象。 -
@Setup
方法注解,会在执行 benchmark 之前被执行,正如其名,主要用于初始化。 -
@TearDown
方法注解,与@Setup 相对的,会在所有 benchmark 执行结束以后执行,主要用于资源的回收等。 -
@Param
成员注解,可以用来指定某项参数的多种情况。特别适合用来测试一个函数在不同的参数输入的情况下的性能。@Param注解接收一个String数组,在@setup方法执行前转化为为对应的数据类型。多个@Param注解的成员之间是乘积关系,譬如有两个用@Param注解的字段,第一个有5个值,第二个字段有2个值,那么每个测试方法会跑5*2=10次。
3.2.2 注解使用例子
以下示例代码来自JMH官方例子,为了节省篇幅删除了头部的license声明和重复的注释。
- @BenchmarkMode和@OutputTimeUnit
public class JMHSample_02_BenchmarkModes {
    @Benchmark
    @BenchmarkMode(Mode.Throughput)
    @OutputTimeUnit(TimeUnit.SECONDS)
    public void measureThroughput() throws InterruptedException {
        TimeUnit.MILLISECONDS.sleep(100);
    }
    /*
     * Mode.AverageTime measures the average execution time, and it does it
     * in the way similar to Mode.Throughput.
     *
     * Some might say it is the reciprocal throughput, and it really is.
     * There are workloads where measuring times is more convenient though.
     */
    @Benchmark
    @BenchmarkMode(Mode.AverageTime)
    @OutputTimeUnit(TimeUnit.MICROSECONDS)
    public void measureAvgTime() throws InterruptedException {
        TimeUnit.MILLISECONDS.sleep(100);
    }
    /*
     * Mode.SampleTime samples the execution time. With this mode, we are
     * still running the method in a time-bound iteration, but instead of
     * measuring the total time, we measure the time spent in *some* of
     * the benchmark method calls.
     *
     * This allows us to infer the distributions, percentiles, etc.
     *
     * JMH also tries to auto-adjust sampling frequency: if the method
     * is long enough, you will end up capturing all the samples.
     */
    @Benchmark
    @BenchmarkMode(Mode.SampleTime)
    @OutputTimeUnit(TimeUnit.MICROSECONDS)
    public void measureSamples() throws InterruptedException {
        TimeUnit.MILLISECONDS.sleep(100);
    }
    /*
     * Mode.SingleShotTime measures the single method invocation time. As the Javadoc
     * suggests, we do only the single benchmark method invocation. The iteration
     * time is meaningless in this mode: as soon as benchmark method stops, the
     * iteration is over.
     *
     * This mode is useful to do cold startup tests, when you specifically
     * do not want to call the benchmark method continuously.
     */
    @Benchmark
    @BenchmarkMode(Mode.SingleShotTime)
    @OutputTimeUnit(TimeUnit.MICROSECONDS)
    public void measureSingleShot() throws InterruptedException {
        TimeUnit.MILLISECONDS.sleep(100);
    }
    /*
     * We can also ask for multiple benchmark modes at once. All the tests
     * above can be replaced with just a single test like this:
     */
    @Benchmark
    @BenchmarkMode({Mode.Throughput, Mode.AverageTime, Mode.SampleTime, Mode.SingleShotTime})
    @OutputTimeUnit(TimeUnit.MICROSECONDS)
    public void measureMultiple() throws InterruptedException {
        TimeUnit.MILLISECONDS.sleep(100);
    }
    /*
     * Or even...
     */
    @Benchmark
    @BenchmarkMode(Mode.All)
    @OutputTimeUnit(TimeUnit.MICROSECONDS)
    public void measureAll() throws InterruptedException {
        TimeUnit.MILLISECONDS.sleep(100);
    }
    /*
     * ============================== HOW TO RUN THIS TEST: ====================================
     *
     * You are expected to see the different run modes for the same benchmark.
     * Note the units are different, scores are consistent with each other.
     *
     * You can run this test:
     *
     * a) Via the command line:
     *    $ mvn clean install
     *    $ java -jar target/benchmarks.jar JMHSample_02 -wi 5 -i 5 -f 1
     *    (we requested 5 warmup/measurement iterations, single fork)
     *
     * b) Via the Java API:
     *    (see the JMH homepage for possible caveats when running from IDE:
     *      http://openjdk.java.net/projects/code-tools/jmh/)
     */
    public static void main(String[] args) throws RunnerException {
        Options opt = new OptionsBuilder()
                .include(JMHSample_02_BenchmarkModes.class.getSimpleName())
                .warmupIterations(5)
                .measurementIterations(5)
                .forks(1)
                .build();
        new Runner(opt).run();
    }
}- @State
public class JMHSample_03_States {
    @State(Scope.Benchmark)
    public static class BenchmarkState {
        volatile double x = Math.PI;
    }
    @State(Scope.Thread)
    public static class ThreadState {
        volatile double x = Math.PI;
    }
    /*
     * Benchmark methods can reference the states, and JMH will inject the
     * appropriate states while calling these methods. You can have no states at
     * all, or have only one state, or have multiple states referenced. This
     * makes building multi-threaded benchmark a breeze.
     *
     * For this exercise, we have two methods.
     */
    @Benchmark
    public void measureUnshared(ThreadState state) {
        // All benchmark threads will call in this method.
        //
        // However, since ThreadState is the Scope.Thread, each thread
        // will have it's own copy of the state, and this benchmark
        // will measure unshared case.
        state.x++;
    }
    @Benchmark
    public void measureShared(BenchmarkState state) {
        // All benchmark threads will call in this method.
        //
        // Since BenchmarkState is the Scope.Benchmark, all threads
        // will share the state instance, and we will end up measuring
        // shared case.
        state.x++;
    }

    public static void main(String[] args) throws RunnerException {
        Options opt = new OptionsBuilder()
                .include(JMHSample_03_States.class.getSimpleName())
                .warmupIterations(5)
                .measurementIterations(5)
                .threads(4)
                .forks(1)
                .build();
        new Runner(opt).run();
    }
}- @Param
@BenchmarkMode(Mode.AverageTime)
@OutputTimeUnit(TimeUnit.NANOSECONDS)
@Warmup(iterations = 5, time = 1, timeUnit = TimeUnit.SECONDS)
@Measurement(iterations = 5, time = 1, timeUnit = TimeUnit.SECONDS)
@Fork(1)
@State(Scope.Benchmark)
public class JMHSample_27_Params {
    /**
     * In many cases, the experiments require walking the configuration space
     * for a benchmark. This is needed for additional control, or investigating
     * how the workload performance changes with different settings.
     */
    @Param({"1", "31", "65", "101", "103"})
    public int arg;
    @Param({"0", "1", "2", "4", "8", "16", "32"})
    public int certainty;
    @Benchmark
    public boolean bench() {
        return BigInteger.valueOf(arg).isProbablePrime(certainty);
    }
    public static void main(String[] args) throws RunnerException {
        Options opt = new OptionsBuilder()
                .include(JMHSample_27_Params.class.getSimpleName())
//                .param("arg", "41", "42") // Use this to selectively constrain/override parameters
                .build();
        new Runner(opt).run();
    }
}
3.2.3 常用选项说明
-
include
benchmark 所在的类的名字,这里可以使用正则表达式对所有类进行匹配。 -
fork
JVM因为使用了profile-guided optimization而“臭名昭著”,这对于微基准测试来说十分不友好,因为不同测试方法的profile混杂在一起,“互相伤害”彼此的测试结果。对于每个@Benchmark方法使用一个独立的进程可以解决这个问题,这也是JMH的默认选项。注意不要设置为0,设置为n则会启动n个进程执行测试(似乎也没有太大意义)。fork选项也可以通过方法注解以及启动参数来设置。 -
warmupIterations
预热的迭代次数,默认1秒。 -
measurementIterations
实际测量的迭代次数,默认1秒。 -
CompilerControl
可以在@Benchmark注解中指定编译器行为。- CompilerControl.Mode.DONT_INLINE:This method should not be inlined. Useful to measure the method call cost and to evaluate if it worth to increase the inline threshold for the JVM.
- CompilerControl.Mode.INLINE:Ask the compiler to inline this method. Usually should be used in conjunction with Mode.DONT_INLINE to check pros and cons of inlining.
- CompilerControl.Mode.EXCLUDE:Do not compile this method – interpret it instead. Useful in holy wars as an argument how good is the JIT.
-
Group
方法注解,可以把多个 benchmark 定义为同一个 group,则它们会被同时执行,譬如用来模拟生产者-消费者读写速度不一致情况下的表现。可以参考如下例子:
CounterBenchmark.java -
Level
用于控制 @Setup,@TearDown 的调用时机,默认是 Level.Trial。-
Trial:每个benchmark方法前后;
-
Iteration:每个benchmark方法每次迭代前后;
-
Invocation:每个benchmark方法每次调用前后,谨慎使用,需留意javadoc注释;
-
-
Threads
每个fork进程使用多少条线程去执行你的测试方法,默认值是Runtime.getRuntime().availableProcessors()。
四、一些值得注意的地方
4.1 无用代码消除(Dead Code Elimination)
现代编译器是十分聪明的,它们会对你的代码进行推导分析,判定哪些代码是无用的然后进行去除,这种行为对微基准测试是致命的,它会使你无法准确测试出你的方法性能。JMH本身已经对这种情况做了处理,你只要记住:1.永远不要写void方法;2.在方法结束返回你的计算结果。有时候如果需要返回多于一个结果,可以考虑自行合并计算结果,或者使用JMH提供的BlackHole对象:
/*
 * This demonstrates Option A:
 *
 * Merge multiple results into one and return it.
 * This is OK when is computation is relatively heavyweight, and merging
 * the results does not offset the results much.
 */
@Benchmark
public double measureRight_1() {
    return Math.log(x1) + Math.log(x2);
}
/*
 * This demonstrates Option B:
 *
 * Use explicit Blackhole objects, and sink the values there.
 * (Background: Blackhole is just another @State object, bundled with JMH).
 */
@Benchmark
public void measureRight_2(Blackhole bh) {
    bh.consume(Math.log(x1));
    bh.consume(Math.log(x2));
}
4.2 常量折叠(Constant Folding)
常量折叠是一种现代编译器优化策略,例如,i = 320 * 200 * 32,多数的现代编译器不会真的产生两个乘法的指令再将结果储存下来,取而代之的,他们会辨识出语句的结构,并在编译时期将数值计算出来(i = 2,048,000)。
在微基准测试中,如果你的计算输入是可预测的,也不是一个@State实例变量,那么很可能会被JIT给优化掉。对此,JMH的建议是:1.永远从@State实例中读取你的方法输入;2.返回你的计算结果;3.或者考虑使用BlackHole对象;
见如下官方例子:
@State(Scope.Thread)
@BenchmarkMode(Mode.AverageTime)
@OutputTimeUnit(TimeUnit.NANOSECONDS)
public class JMHSample_10_ConstantFold {
    private double x = Math.PI;
    private final double wrongX = Math.PI;
    @Benchmark
    public double baseline() {
        // simply return the value, this is a baseline
        return Math.PI;
    }
    @Benchmark
    public double measureWrong_1() {
        // This is wrong: the source is predictable, and computation is foldable.
        return Math.log(Math.PI);
    }
    @Benchmark
    public double measureWrong_2() {
        // This is wrong: the source is predictable, and computation is foldable.
        return Math.log(wrongX);
    }
    @Benchmark
    public double measureRight() {
        // This is correct: the source is not predictable.
        return Math.log(x);
    }
    public static void main(String[] args) throws RunnerException {
        Options opt = new OptionsBuilder()
                .include(JMHSample_10_ConstantFold.class.getSimpleName())
                .warmupIterations(5)
                .measurementIterations(5)
                .forks(1)
                .build();
        new Runner(opt).run();
    }
}
4.3 循环展开(Loop Unwinding)
循环展开最常用来降低循环开销,为具有多个功能单元的处理器提供指令级并行。也有利于指令流水线的调度。例如:
for (i = 1; i <= 60; i++)
   a[i] = a[i] * b + c;
可以展开成:
for (i = 1; i <= 60; i+=3)
{
  a[i] = a[i] * b + c;
  a[i+1] = a[i+1] * b + c;
  a[i+2] = a[i+2] * b + c;
}
由于编译器可能会对你的代码进行循环展开,因此JMH建议不要在你的测试方法中写任何循环。如果确实需要执行循环计算,可以结合@BenchmarkMode(Mode.SingleShotTime)和@Measurement(batchSize = N)来达到同样的效果。参考如下例子:
/*
 * Suppose we want to measure how much it takes to sum two integers:
 */
int x = 1;
int y = 2;
/*
 * This is what you do with JMH.
 */
@Benchmark
@OperationsPerInvocation(100)
public int measureRight() {
    return (x + y);
}
还有这个例子:
@State(Scope.Thread)
@Warmup(iterations = 5, time = 1, timeUnit = TimeUnit.SECONDS)
@Measurement(iterations = 5, time = 1, timeUnit = TimeUnit.SECONDS)
@Fork(3)
@BenchmarkMode(Mode.AverageTime)
@OutputTimeUnit(TimeUnit.NANOSECONDS)
public class JMHSample_34_SafeLooping {
    /*
     * JMHSample_11_Loops warns about the dangers of using loops in @Benchmark methods.
     * Sometimes, however, one needs to traverse through several elements in a dataset.
     * This is hard to do without loops, and therefore we need to devise a scheme for
     * safe looping.
     */
    /*
     * Suppose we want to measure how much it takes to execute work() with different
     * arguments. This mimics a frequent use case when multiple instances with the same
     * implementation, but different data, is measured.
     */
    static final int BASE = 42;
    static int work(int x) {
        return BASE + x;
    }
    /*
     * Every benchmark requires control. We do a trivial control for our benchmarks
     * by checking the benchmark costs are growing linearly with increased task size.
     * If it doesn't, then something wrong is happening.
     */
    @Param({"1", "10", "100", "1000"})
    int size;
    int[] xs;
    @Setup
    public void setup() {
        xs = new int[size];
        for (int c = 0; c < size; c++) {
            xs[c] = c;
        }
    }
    /*
     * First, the obviously wrong way: "saving" the result into a local variable would not
     * work. A sufficiently smart compiler will inline work(), and figure out only the last
     * work() call needs to be evaluated. Indeed, if you run it with varying $size, the score
     * will stay the same!
     */
    @Benchmark
    public int measureWrong_1() {
        int acc = 0;
        for (int x : xs) {
            acc = work(x);
        }
        return acc;
    }
    /*
     * Second, another wrong way: "accumulating" the result into a local variable. While
     * it would force the computation of each work() method, there are software pipelining
     * effects in action, that can merge the operations between two otherwise distinct work()
     * bodies. This will obliterate the benchmark setup.
     *
     * In this example, HotSpot does the unrolled loop, merges the $BASE operands into a single
     * addition to $acc, and then does a bunch of very tight stores of $x-s. The final performance
     * depends on how much of the loop unrolling happened *and* how much data is available to make
     * the large strides.
     */
    @Benchmark
    public int measureWrong_2() {
        int acc = 0;
        for (int x : xs) {
            acc += work(x);
        }
        return acc;
    }
    /*
     * Now, let's see how to measure these things properly. A very straight-forward way to
     * break the merging is to sink each result to Blackhole. This will force runtime to compute
     * every work() call in full. (We would normally like to care about several concurrent work()
     * computations at once, but the memory effects from Blackhole.consume() prevent those optimization
     * on most runtimes).
     */
    @Benchmark
    public void measureRight_1(Blackhole bh) {
        for (int x : xs) {
            bh.consume(work(x));
        }
    }
    /*
     * DANGEROUS AREA, PLEASE READ THE DESCRIPTION BELOW.
     *
     * Sometimes, the cost of sinking the value into a Blackhole is dominating the nano-benchmark score.
     * In these cases, one may try to do a make-shift "sinker" with non-inlineable method. This trick is
     * *very* VM-specific, and can only be used if you are verifying the generated code (that's a good
     * strategy when dealing with nano-benchmarks anyway).
     *
     * You SHOULD NOT use this trick in most cases. Apply only where needed.
     */
    @Benchmark
    public void measureRight_2() {
        for (int x : xs) {
            sink(work(x));
        }
    }
    @CompilerControl(CompilerControl.Mode.DONT_INLINE)
    public static void sink(int v) {
        // IT IS VERY IMPORTANT TO MATCH THE SIGNATURE TO AVOID AUTOBOXING.
        // The method intentionally does nothing.
    }

    public static void main(String[] args) throws RunnerException {
        Options opt = new OptionsBuilder()
                .include(JMHSample_34_SafeLooping.class.getSimpleName())
                .warmupIterations(5)
                .measurementIterations(5)
                .forks(3)
                .build();
        new Runner(opt).run();
    }
}
五、License声明
文中大部分例子来自JMH官方的实例工程:jmh-samples,基于节省篇幅考虑去掉了头部的license声明,现补充如下:
/*
 * Copyright (c) 2014, Oracle America, Inc.
 * All rights reserved.
 *
 * Redistribution and use in source and binary forms, with or without
 * modification, are permitted provided that the following conditions are met:
 *
 *  * Redistributions of source code must retain the above copyright notice,
 *    this list of conditions and the following disclaimer.
 *
 *  * Redistributions in binary form must reproduce the above copyright
 *    notice, this list of conditions and the following disclaimer in the
 *    documentation and/or other materials provided with the distribution.
 *
 *  * Neither the name of Oracle nor the names of its contributors may be used
 *    to endorse or promote products derived from this software without
 *    specific prior written permission.
 *
 * THIS SOFTWARE IS PROVIDED BY THE COPYRIGHT HOLDERS AND CONTRIBUTORS "AS IS"
 * AND ANY EXPRESS OR IMPLIED WARRANTIES, INCLUDING, BUT NOT LIMITED TO, THE
 * IMPLIED WARRANTIES OF MERCHANTABILITY AND FITNESS FOR A PARTICULAR PURPOSE
 * ARE DISCLAIMED. IN NO EVENT SHALL THE COPYRIGHT HOLDER OR CONTRIBUTORS BE
 * LIABLE FOR ANY DIRECT, INDIRECT, INCIDENTAL, SPECIAL, EXEMPLARY, OR
 * CONSEQUENTIAL DAMAGES (INCLUDING, BUT NOT LIMITED TO, PROCUREMENT OF
 * SUBSTITUTE GOODS OR SERVICES; LOSS OF USE, DATA, OR PROFITS; OR BUSINESS
 * INTERRUPTION) HOWEVER CAUSED AND ON ANY THEORY OF LIABILITY, WHETHER IN
 * CONTRACT, STRICT LIABILITY, OR TORT (INCLUDING NEGLIGENCE OR OTHERWISE)
 * ARISING IN ANY WAY OUT OF THE USE OF THIS SOFTWARE, EVEN IF ADVISED OF
 * THE POSSIBILITY OF SUCH DAMAGE.
 */