一、
网址: http://echarts.baidu.com/download.html
点击: 完整
下载文件: echarts.min.js
网址: http://echarts.baidu.com/download-map.html
点击: 中国地图 - JS
下载文件: china.js
二、代码示例
<!DOCTYPE html>
<html>
    <head>
        <meta charset="UTF-8">
        <meta http-equiv="X-UA-Compatible" content="IE=EDGE">
        <title>ECharts</title>
        <link rel="stylesheet" type="text/css" href="css/main.css"/>
        <script src="js/jquery-1.9.1.min.js"></script>
        <script src="js/echarts.min.js"></script>
        <script src="js/china.js"></script>
        <style>#china-map {width:1000px; height: 1000px;margin: auto;}</style>
    </head>
    <body>

        <div id="china-map"></div>

        <script>
            var myChart = echarts.init(document.getElementById('china-map'));
            var option = {
                tooltip: {
//                    show: false //不显示提示标签
                    formatter: '{b}', //提示标签格式
                    backgroundColor:"#ff7f50",//提示标签背景颜色
                    textStyle:{color:"#fff"} //提示标签字体颜色
                },
                series: [{
                    type: 'map',
                    mapType: 'china',
                    label: {
                        normal: {
                            show: true,//显示省份标签
                            textStyle:{color:"#c71585"}//省份标签字体颜色
                        },
                        emphasis: {//对应的鼠标悬浮效果
                            show: true,
                            textStyle:{color:"#800080"}
                        }
                    },
                    itemStyle: {
                        normal: {
                            borderWidth: .5,//区域边框宽度
                            borderColor: '#009fe8',//区域边框颜色
                            areaColor:"#ffefd5",//区域颜色
                        },
                        emphasis: {
                            borderWidth: .5,
                            borderColor: '#4b0082',
                            areaColor:"#ffdead",
                        }
                    },
                    data:[
                        {name:'福建', selected:true}//福建为选中状态
                    ]
                }],
            };

            myChart.setOption(option);
            myChart.on('mouseover', function (params) {
                var dataIndex = params.dataIndex;
                console.log(params);
            });
        </script>

    </body>
</html>
三、效果图
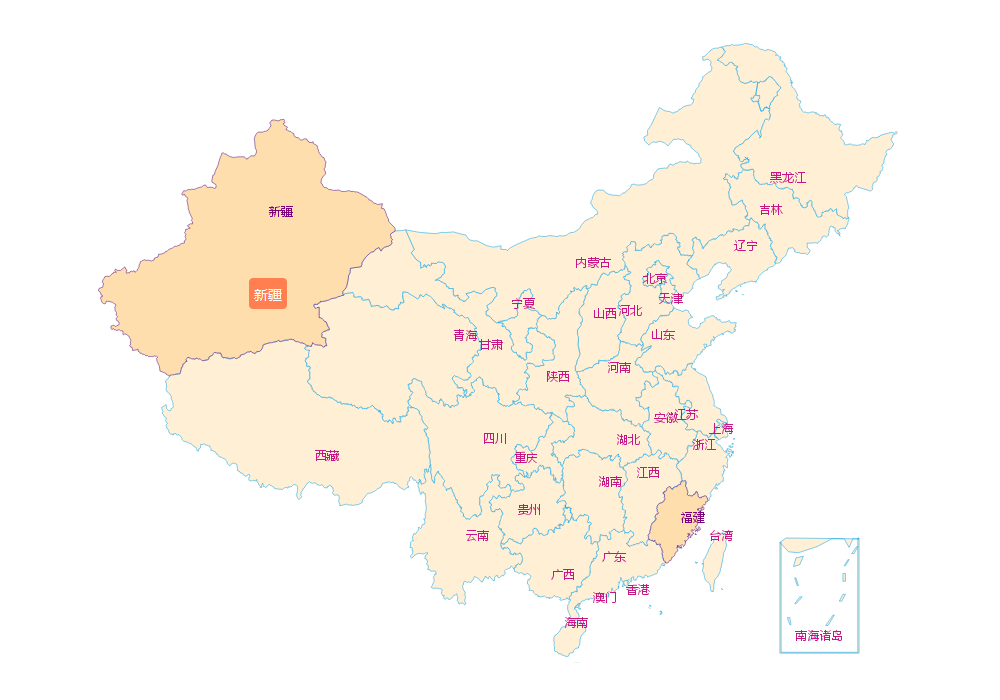
四、修改省份标签位置:
打开china.js文件,修改"properties":{"cp":[X坐标,Y坐标],...}