prometheus架构图

prometheus 各组件介绍
- Prometheus Server: 使用pull方式采集监控数据,在该组件上配置监控数据的采集和告警规则。
- Client Library: 客户端库,为需要监控的服务生成相应的 metrics 并暴露给 prometheus server。当 prometheus server 来 pull 时,直接返回实时状态的 metrics。
- Push Gateway: 主要用于短期的 jobs。由于这类 jobs 存在时间较短,可能在prometheus来pull之前就消失了。为此,这次 jobs 可以直接向 Prometheus server 端推送它们的 metrics。这种方式主要用于服务层面的 metrics,对于机器层面的 metrices,需要使用 node exporter。
- Exporters: 用于暴露已有的第三方服务的 metrics 给 Prometheus。
- Alertmanager: 用于接收promethues发出的告警做进一步处理,对告警进行聚合、下发、抑制等。常见的告警方式有:邮件,钉钉,webhook 等一些其他的工具。
安装prometheus
# wget https://github.com/prometheus/prometheus/releases/download/v2.8.1/prometheus-2.8.1.linux-amd64.tar.gz
# tar xzvf prometheus-2.8.1.linux-amd64.tar.gz
# mv prometheus-2.8.1.linux-amd64 /usr/local/promethues
配置文件prometheus.yml
global:  #全局配置
  scrape_interval: 15s  # 收集数据的间隔时间,默认为1m
  scrape_timeout: 10s  #请求接口获取metrics数据的超时时间
  evaluation_interval: 15s # Evaluate rules every 15 seconds. The default is every 1 minute.
#alerting:    #告警配置
#  alertmanagers:
#  - static_configs:
#    - targets: ['127.0.0.1:9093']
#rule_files:   #告警规则配置
#  - "rules/*.yml"
scrape_configs:  #配置被监控端
  - job_name: 'prometheus'
    static_configs:
    - targets: ['localhost:9090']
#  - job_name: 'test-node'
#    file_sd_configs:
#      - files: ['/usr/local/prometheus/sd_config/node.yml']
#        refresh_interval: 5s
#remote_write:  #配置远程存储
#  [ - <remote_write> ...]
#remote_read:
#  [ - <remote_read> ...]
检查配置文件有没有错误:
# ./promtool check config prometheus.yml
重载prometheus配置文件的两种方法:
- 1,通过HTTP API向/-/reload发送POST请求,例:curl -X POST http://localhost:9090/-/reload (这种方式必须在prometheus启动参数里面加上参数:--web.enable-lifecycle)
- 2,prometheus进程发送SIGHUP信号 # kill -HUP `pgrep prometheus`
启动
以守护进程的方式启动:


[Unit]
Description=prometheus

[Service]
Restart=on-failure
ExecStart=/usr/local/prometheus/prometheus --config.file=/usr/local/prometheus/prometheus.yml

[Install]
WantedBy=multi-user.target
# systemctl daemon-reload
# systemctl start prometheus
访问查看ip:9090 可以看到prometheus的web界面展示。查看Ip:9090/metrics可以看到prometheus提供的自身相关的metrics。

数据模型
Prometheus 中存储的数据为时间序列,每个时间序列是由度量名称(metric)和一系列键值对(标签)唯一标识的。
格式:<metric name>{<label name>=<label value>, …},例如:http_requests_total{method="POST",endpoint="/api/tracks"}。
指标名称:用户说明指标的含义,例如http_requests_total代表http请求总数。
指标分类:counter:递增的计数器类型,例如机器启动时间,http访问量等。
gauge:指标实时变化情况,可以任意变化的数值,例如cpu、内存使用量、网络io等。
histogram:反映某个区间内的样本个数,通过{le="上边界"}指定这个范围的样本数。通常它采集的数据展示为直方图。
summary:类似于histogram。
标签:体现指标的维度特性,用于过滤和聚合。
标签
- 添加标签label
修改配置文件prometheus.yml
    static_configs:
    - targets: ['localhost:9090']
      labels:
        idc: sz
查找 process_cpu_seconds_total 指标
可以看到原来的 process_cpu_seconds_total{instance="localhost:9090",job="prometheus"}
变成了 process_cpu_seconds_total{idc="sz",instance="localhost:9090",job="prometheus"} #添加了idc="sz"这个标签
- relabel
例如原来是:process_cpu_seconds_total{instance="localhost:9090",job="sz"}
scrape_configs:
  - job_name: 'sz'
    static_configs:
    - targets: ['localhost:9090']
    relabel_configs:
      - action: replace
        source_labels: ['job']
        regex: (.*)
        replacement: $1
        target_label: idc

#action : 重新标签动作
#replace: 默认,通过regex匹配source_label的值,使用replacement来引用表达式匹配的分组
#keep:删除regrex与连接不匹配的目标source_labels,保留正则匹配的。
#drop: 删除regrex与连接匹配的目标source_labels
#labeldrop:删除regex匹配的标签
#labelkeep:删除regex不匹配的标签
#hashmod:设置target_labels为modules连接的哈希值source_labels
#labelmap:匹配regex所有标签名称,然后复制匹配标签的值进行分组,#replacement分组引用($(1),$(2)...)替代
process_cpu_seconds_total{idc="sz",instance="localhost:9090",job="sz"} # 原标签也会保留
node_exporter 监控linux服务器的系统信息
客户端安装
# wget https://github.com/prometheus/node_exporter/releases/download/v0.17.0/node_exporter-0.17.0.linux-amd64.tar.gz
# tar xzvf node_exporter-0.17.0.linux-amd64.tar.gz
# mv node_exporter-0.17.0.linux-amd64 /usr/local/node_exporter
# cd /usr/local/node_exporter/
[Unit]
Description=node_exporter
[Service]
Restart=on-failure
ExecStart=/usr/local/node_exporter/node_exporter
[Install]
WantedBy=multi-user.target
启动:
# systemctl daemon-reload
# systemctl start node_exporter
# netstat -nlap |grep 9100
tcp6 0 0 :::9100 :::* LISTEN 10016/node_exporter
prometheus server端配置添加被监控的节点
# vim prometheus.yml
  - job_name: 'test-node'
    file_sd_configs:
      - files: ['/usr/local/prometheus/sd_config/node.yml']
        refresh_interval: 5s
# cat sd_config/node.yml
- targets: ["192.168.1.12:9100"]
可以通过浏览器访问 http://localhost:9100/metrics 查看metrics暴露的指标数据
也可以直接curl http://localhost:9100/metrics
# HELP go_gc_duration_seconds A summary of the GC invocation durations.
# TYPE go_gc_duration_seconds summary
go_gc_duration_seconds{quantile="0"} 9.457e-06
go_gc_duration_seconds{quantile="0.25"} 1.3434e-05
go_gc_duration_seconds{quantile="0.5"} 1.5029e-05
go_gc_duration_seconds{quantile="0.75"} 1.9438e-05
go_gc_duration_seconds{quantile="1"} 5.0626e-05
go_gc_duration_seconds_sum 2.462879354
go_gc_duration_seconds_count 151333
# HELP go_goroutines Number of goroutines that currently exist.
# TYPE go_goroutines gauge
go_goroutines 7
# HELP go_info Information about the Go environment.
# TYPE go_info gauge
go_info{version="go1.11.2"} 1
# HELP go_memstats_alloc_bytes Number of bytes allocated and still in use.
# TYPE go_memstats_alloc_bytes gauge
go_memstats_alloc_bytes 1.597592e+06
# HELP go_memstats_alloc_bytes_total Total number of bytes allocated, even if freed.
# TYPE go_memstats_alloc_bytes_total counter
go_memstats_alloc_bytes_total 4.22028398816e+11
# HELP go_memstats_buck_hash_sys_bytes Number of bytes used by the profiling bucket hash table.
# TYPE go_memstats_buck_hash_sys_bytes gauge
go_memstats_buck_hash_sys_bytes 2.36646e+06
# HELP go_memstats_frees_total Total number of frees.
# TYPE go_memstats_frees_total counter
go_memstats_frees_total 4.770889735e+09
# HELP go_memstats_gc_cpu_fraction The fraction of this program's available CPU time used by the GC since the program started.
# TYPE go_memstats_gc_cpu_fraction gauge
go_memstats_gc_cpu_fraction 0.00019053204931613853
# HELP go_memstats_gc_sys_bytes Number of bytes used for garbage collection system metadata.
# TYPE go_memstats_gc_sys_bytes gauge
go_memstats_gc_sys_bytes 2.371584e+06
# HELP go_memstats_heap_alloc_bytes Number of heap bytes allocated and still in use.
# TYPE go_memstats_heap_alloc_bytes gauge
go_memstats_heap_alloc_bytes 1.597592e+06
# HELP go_memstats_heap_idle_bytes Number of heap bytes waiting to be used.
# TYPE go_memstats_heap_idle_bytes gauge
go_memstats_heap_idle_bytes 6.4167936e+07
# HELP go_memstats_heap_inuse_bytes Number of heap bytes that are in use.
# TYPE go_memstats_heap_inuse_bytes gauge
go_memstats_heap_inuse_bytes 2.58048e+06
# HELP go_memstats_heap_objects Number of allocated objects.
# TYPE go_memstats_heap_objects gauge
go_memstats_heap_objects 4106
# HELP go_memstats_heap_released_bytes Number of heap bytes released to OS.
# TYPE go_memstats_heap_released_bytes gauge
go_memstats_heap_released_bytes 0
# HELP go_memstats_heap_sys_bytes Number of heap bytes obtained from system.
# TYPE go_memstats_heap_sys_bytes gauge
go_memstats_heap_sys_bytes 6.6748416e+07
# HELP go_memstats_last_gc_time_seconds Number of seconds since 1970 of last garbage collection.
# TYPE go_memstats_last_gc_time_seconds gauge
go_memstats_last_gc_time_seconds 1.5547092709770155e+09
# HELP go_memstats_lookups_total Total number of pointer lookups.
# TYPE go_memstats_lookups_total counter
go_memstats_lookups_total 0
# HELP go_memstats_mallocs_total Total number of mallocs.
# TYPE go_memstats_mallocs_total counter
go_memstats_mallocs_total 4.770893841e+09
# HELP go_memstats_mcache_inuse_bytes Number of bytes in use by mcache structures.
# TYPE go_memstats_mcache_inuse_bytes gauge
go_memstats_mcache_inuse_bytes 1728
# HELP go_memstats_mcache_sys_bytes Number of bytes used for mcache structures obtained from system.
# TYPE go_memstats_mcache_sys_bytes gauge
go_memstats_mcache_sys_bytes 16384
# HELP go_memstats_mspan_inuse_bytes Number of bytes in use by mspan structures.
# TYPE go_memstats_mspan_inuse_bytes gauge
go_memstats_mspan_inuse_bytes 30400
# HELP go_memstats_mspan_sys_bytes Number of bytes used for mspan structures obtained from system.
# TYPE go_memstats_mspan_sys_bytes gauge
go_memstats_mspan_sys_bytes 65536
# HELP go_memstats_next_gc_bytes Number of heap bytes when next garbage collection will take place.
# TYPE go_memstats_next_gc_bytes gauge
go_memstats_next_gc_bytes 4.194304e+06
# HELP go_memstats_other_sys_bytes Number of bytes used for other system allocations.
# TYPE go_memstats_other_sys_bytes gauge
go_memstats_other_sys_bytes 355580
# HELP go_memstats_stack_inuse_bytes Number of bytes in use by the stack allocator.
# TYPE go_memstats_stack_inuse_bytes gauge
go_memstats_stack_inuse_bytes 360448
# HELP go_memstats_stack_sys_bytes Number of bytes obtained from system for stack allocator.
# TYPE go_memstats_stack_sys_bytes gauge
go_memstats_stack_sys_bytes 360448
# HELP go_memstats_sys_bytes Number of bytes obtained from system.
# TYPE go_memstats_sys_bytes gauge
go_memstats_sys_bytes 7.2284408e+07
# HELP go_threads Number of OS threads created.
# TYPE go_threads gauge
go_threads 4
# HELP node_arp_entries ARP entries by device
# TYPE node_arp_entries gauge
node_arp_entries{device="eth0"} 94
# HELP node_boot_time_seconds Node boot time, in unixtime.
# TYPE node_boot_time_seconds gauge
node_boot_time_seconds 1.517266421e+09
# HELP node_context_switches_total Total number of context switches.
# TYPE node_context_switches_total counter
node_context_switches_total 1.4017581608e+10
# HELP node_cpu_guest_seconds_total Seconds the cpus spent in guests (VMs) for each mode.
# TYPE node_cpu_guest_seconds_total counter
node_cpu_guest_seconds_total{cpu="0",mode="nice"} 0
node_cpu_guest_seconds_total{cpu="0",mode="user"} 0
# HELP node_cpu_seconds_total Seconds the cpus spent in each mode.
# TYPE node_cpu_seconds_total counter
node_cpu_seconds_total{cpu="0",mode="idle"} 3.150272624e+07
node_cpu_seconds_total{cpu="0",mode="iowait"} 8235.26
node_cpu_seconds_total{cpu="0",mode="irq"} 0
node_cpu_seconds_total{cpu="0",mode="nice"} 155.86
node_cpu_seconds_total{cpu="0",mode="softirq"} 1313.82
node_cpu_seconds_total{cpu="0",mode="steal"} 0
node_cpu_seconds_total{cpu="0",mode="system"} 638845.83
node_cpu_seconds_total{cpu="0",mode="user"} 5.23167768e+06
# HELP node_disk_io_now The number of I/Os currently in progress.
# TYPE node_disk_io_now gauge
node_disk_io_now{device="sr0"} 0
node_disk_io_now{device="vda"} 0
# HELP node_disk_io_time_seconds_total Total seconds spent doing I/Os.
# TYPE node_disk_io_time_seconds_total counter
node_disk_io_time_seconds_total{device="sr0"} 0
node_disk_io_time_seconds_total{device="vda"} 47700.901
# HELP node_disk_io_time_weighted_seconds_total The weighted # of seconds spent doing I/Os.
# TYPE node_disk_io_time_weighted_seconds_total counter
node_disk_io_time_weighted_seconds_total{device="sr0"} 0
node_disk_io_time_weighted_seconds_total{device="vda"} 2.0911166840000001e+06
# HELP node_disk_read_bytes_total The total number of bytes read successfully.
# TYPE node_disk_read_bytes_total counter
node_disk_read_bytes_total{device="sr0"} 0
node_disk_read_bytes_total{device="vda"} 8.671668736e+10
# HELP node_disk_read_time_seconds_total The total number of seconds spent by all reads.
# TYPE node_disk_read_time_seconds_total counter
node_disk_read_time_seconds_total{device="sr0"} 0
node_disk_read_time_seconds_total{device="vda"} 29248.991
# HELP node_disk_reads_completed_total The total number of reads completed successfully.
# TYPE node_disk_reads_completed_total counter
node_disk_reads_completed_total{device="sr0"} 0
node_disk_reads_completed_total{device="vda"} 4.011729e+06
# HELP node_disk_reads_merged_total The total number of reads merged.
# TYPE node_disk_reads_merged_total counter
node_disk_reads_merged_total{device="sr0"} 0
node_disk_reads_merged_total{device="vda"} 9382
# HELP node_disk_write_time_seconds_total This is the total number of seconds spent by all writes.
# TYPE node_disk_write_time_seconds_total counter
node_disk_write_time_seconds_total{device="sr0"} 0
node_disk_write_time_seconds_total{device="vda"} 2.061890504e+06
# HELP node_disk_writes_completed_total The total number of writes completed successfully.
# TYPE node_disk_writes_completed_total counter
node_disk_writes_completed_total{device="sr0"} 0
node_disk_writes_completed_total{device="vda"} 1.19839672e+08
# HELP node_disk_writes_merged_total The number of writes merged.
# TYPE node_disk_writes_merged_total counter
node_disk_writes_merged_total{device="sr0"} 0
node_disk_writes_merged_total{device="vda"} 3.300321e+07
# HELP node_disk_written_bytes_total The total number of bytes written successfully.
# TYPE node_disk_written_bytes_total counter
node_disk_written_bytes_total{device="sr0"} 0
node_disk_written_bytes_total{device="vda"} 8.25230344192e+11
# HELP node_entropy_available_bits Bits of available entropy.
# TYPE node_entropy_available_bits gauge
node_entropy_available_bits 184
# HELP node_exporter_build_info A metric with a constant '1' value labeled by version, revision, branch, and goversion from which node_exporter was built.
# TYPE node_exporter_build_info gauge
node_exporter_build_info{branch="HEAD",goversion="go1.11.2",revision="f6f6194a436b9a63d0439abc585c76b19a206b21",version="0.17.0"} 1
# HELP node_filefd_allocated File descriptor statistics: allocated.
# TYPE node_filefd_allocated gauge
node_filefd_allocated 832
# HELP node_filefd_maximum File descriptor statistics: maximum.
# TYPE node_filefd_maximum gauge
node_filefd_maximum 98599
# HELP node_filesystem_avail_bytes Filesystem space available to non-root users in bytes.
# TYPE node_filesystem_avail_bytes gauge
node_filesystem_avail_bytes{device="/dev/vda1",fstype="ext4",mountpoint="/"} 2.4192053248e+10
node_filesystem_avail_bytes{device="rootfs",fstype="rootfs",mountpoint="/"} 2.4192053248e+10
node_filesystem_avail_bytes{device="tmpfs",fstype="tmpfs",mountpoint="/run"} 5.20024064e+08
node_filesystem_avail_bytes{device="tmpfs",fstype="tmpfs",mountpoint="/run/netns"} 5.20024064e+08
node_filesystem_avail_bytes{device="tmpfs",fstype="tmpfs",mountpoint="/run/user/0"} 1.0407936e+08
# HELP node_filesystem_device_error Whether an error occurred while getting statistics for the given device.
# TYPE node_filesystem_device_error gauge
node_filesystem_device_error{device="/dev/vda1",fstype="ext4",mountpoint="/"} 0
node_filesystem_device_error{device="rootfs",fstype="rootfs",mountpoint="/"} 0
node_filesystem_device_error{device="tmpfs",fstype="tmpfs",mountpoint="/run"} 0
node_filesystem_device_error{device="tmpfs",fstype="tmpfs",mountpoint="/run/netns"} 0
node_filesystem_device_error{device="tmpfs",fstype="tmpfs",mountpoint="/run/user/0"} 0
# HELP node_filesystem_files Filesystem total file nodes.
# TYPE node_filesystem_files gauge
node_filesystem_files{device="/dev/vda1",fstype="ext4",mountpoint="/"} 2.62144e+06
node_filesystem_files{device="rootfs",fstype="rootfs",mountpoint="/"} 2.62144e+06
node_filesystem_files{device="tmpfs",fstype="tmpfs",mountpoint="/run"} 127049
node_filesystem_files{device="tmpfs",fstype="tmpfs",mountpoint="/run/netns"} 127049
node_filesystem_files{device="tmpfs",fstype="tmpfs",mountpoint="/run/user/0"} 127049
# HELP node_filesystem_files_free Filesystem total free file nodes.
# TYPE node_filesystem_files_free gauge
node_filesystem_files_free{device="/dev/vda1",fstype="ext4",mountpoint="/"} 2.40378e+06
node_filesystem_files_free{device="rootfs",fstype="rootfs",mountpoint="/"} 2.40378e+06
node_filesystem_files_free{device="tmpfs",fstype="tmpfs",mountpoint="/run"} 126644
node_filesystem_files_free{device="tmpfs",fstype="tmpfs",mountpoint="/run/netns"} 126644
node_filesystem_files_free{device="tmpfs",fstype="tmpfs",mountpoint="/run/user/0"} 127048
# HELP node_filesystem_free_bytes Filesystem free space in bytes.
# TYPE node_filesystem_free_bytes gauge
node_filesystem_free_bytes{device="/dev/vda1",fstype="ext4",mountpoint="/"} 2.6356260864e+10
node_filesystem_free_bytes{device="rootfs",fstype="rootfs",mountpoint="/"} 2.6356260864e+10
node_filesystem_free_bytes{device="tmpfs",fstype="tmpfs",mountpoint="/run"} 5.20024064e+08
node_filesystem_free_bytes{device="tmpfs",fstype="tmpfs",mountpoint="/run/netns"} 5.20024064e+08
node_filesystem_free_bytes{device="tmpfs",fstype="tmpfs",mountpoint="/run/user/0"} 1.0407936e+08
# HELP node_filesystem_readonly Filesystem read-only status.
# TYPE node_filesystem_readonly gauge
node_filesystem_readonly{device="/dev/vda1",fstype="ext4",mountpoint="/"} 0
node_filesystem_readonly{device="rootfs",fstype="rootfs",mountpoint="/"} 0
node_filesystem_readonly{device="tmpfs",fstype="tmpfs",mountpoint="/run"} 0
node_filesystem_readonly{device="tmpfs",fstype="tmpfs",mountpoint="/run/netns"} 0
node_filesystem_readonly{device="tmpfs",fstype="tmpfs",mountpoint="/run/user/0"} 0
# HELP node_filesystem_size_bytes Filesystem size in bytes.
# TYPE node_filesystem_size_bytes gauge
node_filesystem_size_bytes{device="/dev/vda1",fstype="ext4",mountpoint="/"} 4.2140499968e+10
node_filesystem_size_bytes{device="rootfs",fstype="rootfs",mountpoint="/"} 4.2140499968e+10
node_filesystem_size_bytes{device="tmpfs",fstype="tmpfs",mountpoint="/run"} 5.20392704e+08
node_filesystem_size_bytes{device="tmpfs",fstype="tmpfs",mountpoint="/run/netns"} 5.20392704e+08
node_filesystem_size_bytes{device="tmpfs",fstype="tmpfs",mountpoint="/run/user/0"} 1.0407936e+08
# HELP node_forks_total Total number of forks.
# TYPE node_forks_total counter
node_forks_total 3.95571337e+08
# HELP node_intr_total Total number of interrupts serviced.
# TYPE node_intr_total counter
node_intr_total 2.000731106e+09
# HELP node_load1 1m load average.
# TYPE node_load1 gauge
node_load1 0
# HELP node_load15 15m load average.
# TYPE node_load15 gauge
node_load15 0.05
# HELP node_load5 5m load average.
# TYPE node_load5 gauge
node_load5 0.01
# HELP node_memory_Active_anon_bytes Memory information field Active_anon_bytes.
# TYPE node_memory_Active_anon_bytes gauge
node_memory_Active_anon_bytes 1.94281472e+08
# HELP node_memory_Active_bytes Memory information field Active_bytes.
# TYPE node_memory_Active_bytes gauge
node_memory_Active_bytes 6.33245696e+08
# HELP node_memory_Active_file_bytes Memory information field Active_file_bytes.
# TYPE node_memory_Active_file_bytes gauge
node_memory_Active_file_bytes 4.38964224e+08
# HELP node_memory_AnonHugePages_bytes Memory information field AnonHugePages_bytes.
# TYPE node_memory_AnonHugePages_bytes gauge
node_memory_AnonHugePages_bytes 1.30023424e+08
# HELP node_memory_AnonPages_bytes Memory information field AnonPages_bytes.
# TYPE node_memory_AnonPages_bytes gauge
node_memory_AnonPages_bytes 1.94154496e+08
# HELP node_memory_Bounce_bytes Memory information field Bounce_bytes.
# TYPE node_memory_Bounce_bytes gauge
node_memory_Bounce_bytes 0
# HELP node_memory_Buffers_bytes Memory information field Buffers_bytes.
# TYPE node_memory_Buffers_bytes gauge
node_memory_Buffers_bytes 1.17886976e+08
# HELP node_memory_Cached_bytes Memory information field Cached_bytes.
# TYPE node_memory_Cached_bytes gauge
node_memory_Cached_bytes 5.28580608e+08
# HELP node_memory_CommitLimit_bytes Memory information field CommitLimit_bytes.
# TYPE node_memory_CommitLimit_bytes gauge
node_memory_CommitLimit_bytes 5.20392704e+08
# HELP node_memory_Committed_AS_bytes Memory information field Committed_AS_bytes.
# TYPE node_memory_Committed_AS_bytes gauge
node_memory_Committed_AS_bytes 1.1303936e+09
# HELP node_memory_DirectMap1G_bytes Memory information field DirectMap1G_bytes.
# TYPE node_memory_DirectMap1G_bytes gauge
node_memory_DirectMap1G_bytes 0
# HELP node_memory_DirectMap2M_bytes Memory information field DirectMap2M_bytes.
# TYPE node_memory_DirectMap2M_bytes gauge
node_memory_DirectMap2M_bytes 1.010827264e+09
# HELP node_memory_DirectMap4k_bytes Memory information field DirectMap4k_bytes.
# TYPE node_memory_DirectMap4k_bytes gauge
node_memory_DirectMap4k_bytes 6.2783488e+07
# HELP node_memory_Dirty_bytes Memory information field Dirty_bytes.
# TYPE node_memory_Dirty_bytes gauge
node_memory_Dirty_bytes 0
# HELP node_memory_HardwareCorrupted_bytes Memory information field HardwareCorrupted_bytes.
# TYPE node_memory_HardwareCorrupted_bytes gauge
node_memory_HardwareCorrupted_bytes 0
# HELP node_memory_HugePages_Free Memory information field HugePages_Free.
# TYPE node_memory_HugePages_Free gauge
node_memory_HugePages_Free 0
# HELP node_memory_HugePages_Rsvd Memory information field HugePages_Rsvd.
# TYPE node_memory_HugePages_Rsvd gauge
node_memory_HugePages_Rsvd 0
# HELP node_memory_HugePages_Surp Memory information field HugePages_Surp.
# TYPE node_memory_HugePages_Surp gauge
node_memory_HugePages_Surp 0
# HELP node_memory_HugePages_Total Memory information field HugePages_Total.
# TYPE node_memory_HugePages_Total gauge
node_memory_HugePages_Total 0
# HELP node_memory_Hugepagesize_bytes Memory information field Hugepagesize_bytes.
# TYPE node_memory_Hugepagesize_bytes gauge
node_memory_Hugepagesize_bytes 2.097152e+06
# HELP node_memory_Inactive_anon_bytes Memory information field Inactive_anon_bytes.
# TYPE node_memory_Inactive_anon_bytes gauge
node_memory_Inactive_anon_bytes 253952
# HELP node_memory_Inactive_bytes Memory information field Inactive_bytes.
# TYPE node_memory_Inactive_bytes gauge
node_memory_Inactive_bytes 2.07376384e+08
# HELP node_memory_Inactive_file_bytes Memory information field Inactive_file_bytes.
# TYPE node_memory_Inactive_file_bytes gauge
node_memory_Inactive_file_bytes 2.07122432e+08
# HELP node_memory_KernelStack_bytes Memory information field KernelStack_bytes.
# TYPE node_memory_KernelStack_bytes gauge
node_memory_KernelStack_bytes 1.982464e+06
# HELP node_memory_Mapped_bytes Memory information field Mapped_bytes.
# TYPE node_memory_Mapped_bytes gauge
node_memory_Mapped_bytes 7.493632e+07
# HELP node_memory_MemAvailable_bytes Memory information field MemAvailable_bytes.
# TYPE node_memory_MemAvailable_bytes gauge
node_memory_MemAvailable_bytes 6.30509568e+08
# HELP node_memory_MemFree_bytes Memory information field MemFree_bytes.
# TYPE node_memory_MemFree_bytes gauge
node_memory_MemFree_bytes 7.8630912e+07
# HELP node_memory_MemTotal_bytes Memory information field MemTotal_bytes.
# TYPE node_memory_MemTotal_bytes gauge
node_memory_MemTotal_bytes 1.040789504e+09
# HELP node_memory_Mlocked_bytes Memory information field Mlocked_bytes.
# TYPE node_memory_Mlocked_bytes gauge
node_memory_Mlocked_bytes 0
# HELP node_memory_NFS_Unstable_bytes Memory information field NFS_Unstable_bytes.
# TYPE node_memory_NFS_Unstable_bytes gauge
node_memory_NFS_Unstable_bytes 0
# HELP node_memory_PageTables_bytes Memory information field PageTables_bytes.
# TYPE node_memory_PageTables_bytes gauge
node_memory_PageTables_bytes 4.988928e+06
# HELP node_memory_SReclaimable_bytes Memory information field SReclaimable_bytes.
# TYPE node_memory_SReclaimable_bytes gauge
node_memory_SReclaimable_bytes 7.3293824e+07
# HELP node_memory_SUnreclaim_bytes Memory information field SUnreclaim_bytes.
# TYPE node_memory_SUnreclaim_bytes gauge
node_memory_SUnreclaim_bytes 2.3773184e+07
# HELP node_memory_Shmem_bytes Memory information field Shmem_bytes.
# TYPE node_memory_Shmem_bytes gauge
node_memory_Shmem_bytes 380928
# HELP node_memory_Slab_bytes Memory information field Slab_bytes.
# TYPE node_memory_Slab_bytes gauge
node_memory_Slab_bytes 9.7067008e+07
# HELP node_memory_SwapCached_bytes Memory information field SwapCached_bytes.
# TYPE node_memory_SwapCached_bytes gauge
node_memory_SwapCached_bytes 0
# HELP node_memory_SwapFree_bytes Memory information field SwapFree_bytes.
# TYPE node_memory_SwapFree_bytes gauge
node_memory_SwapFree_bytes 0
# HELP node_memory_SwapTotal_bytes Memory information field SwapTotal_bytes.
# TYPE node_memory_SwapTotal_bytes gauge
node_memory_SwapTotal_bytes 0
# HELP node_memory_Unevictable_bytes Memory information field Unevictable_bytes.
# TYPE node_memory_Unevictable_bytes gauge
node_memory_Unevictable_bytes 0
# HELP node_memory_VmallocChunk_bytes Memory information field VmallocChunk_bytes.
# TYPE node_memory_VmallocChunk_bytes gauge
node_memory_VmallocChunk_bytes 3.5184352948224e+13
# HELP node_memory_VmallocTotal_bytes Memory information field VmallocTotal_bytes.
# TYPE node_memory_VmallocTotal_bytes gauge
node_memory_VmallocTotal_bytes 3.5184372087808e+13
# HELP node_memory_VmallocUsed_bytes Memory information field VmallocUsed_bytes.
# TYPE node_memory_VmallocUsed_bytes gauge
node_memory_VmallocUsed_bytes 8.916992e+06
# HELP node_memory_WritebackTmp_bytes Memory information field WritebackTmp_bytes.
# TYPE node_memory_WritebackTmp_bytes gauge
node_memory_WritebackTmp_bytes 0
# HELP node_memory_Writeback_bytes Memory information field Writeback_bytes.
# TYPE node_memory_Writeback_bytes gauge
node_memory_Writeback_bytes 0
# HELP node_netstat_Icmp6_InErrors Statistic Icmp6InErrors.
# TYPE node_netstat_Icmp6_InErrors untyped
node_netstat_Icmp6_InErrors 0
# HELP node_netstat_Icmp6_InMsgs Statistic Icmp6InMsgs.
# TYPE node_netstat_Icmp6_InMsgs untyped
node_netstat_Icmp6_InMsgs 0
# HELP node_netstat_Icmp6_OutMsgs Statistic Icmp6OutMsgs.
# TYPE node_netstat_Icmp6_OutMsgs untyped
node_netstat_Icmp6_OutMsgs 0
# HELP node_netstat_Icmp_InErrors Statistic IcmpInErrors.
# TYPE node_netstat_Icmp_InErrors untyped
node_netstat_Icmp_InErrors 45856
# HELP node_netstat_Icmp_InMsgs Statistic IcmpInMsgs.
# TYPE node_netstat_Icmp_InMsgs untyped
node_netstat_Icmp_InMsgs 1.9115796e+07
# HELP node_netstat_Icmp_OutMsgs Statistic IcmpOutMsgs.
# TYPE node_netstat_Icmp_OutMsgs untyped
node_netstat_Icmp_OutMsgs 1.9410091e+07
# HELP node_netstat_Ip6_InOctets Statistic Ip6InOctets.
# TYPE node_netstat_Ip6_InOctets untyped
node_netstat_Ip6_InOctets 536
# HELP node_netstat_Ip6_OutOctets Statistic Ip6OutOctets.
# TYPE node_netstat_Ip6_OutOctets untyped
node_netstat_Ip6_OutOctets 0
# HELP node_netstat_IpExt_InOctets Statistic IpExtInOctets.
# TYPE node_netstat_IpExt_InOctets untyped
node_netstat_IpExt_InOctets 7.524794161e+09
# HELP node_netstat_IpExt_OutOctets Statistic IpExtOutOctets.
# TYPE node_netstat_IpExt_OutOctets untyped
node_netstat_IpExt_OutOctets 5.5906455833e+10
# HELP node_netstat_Ip_Forwarding Statistic IpForwarding.
# TYPE node_netstat_Ip_Forwarding untyped
node_netstat_Ip_Forwarding 2
# HELP node_netstat_TcpExt_ListenDrops Statistic TcpExtListenDrops.
# TYPE node_netstat_TcpExt_ListenDrops untyped
node_netstat_TcpExt_ListenDrops 1.070406e+06
# HELP node_netstat_TcpExt_ListenOverflows Statistic TcpExtListenOverflows.
# TYPE node_netstat_TcpExt_ListenOverflows untyped
node_netstat_TcpExt_ListenOverflows 0
# HELP node_netstat_TcpExt_SyncookiesFailed Statistic TcpExtSyncookiesFailed.
# TYPE node_netstat_TcpExt_SyncookiesFailed untyped
node_netstat_TcpExt_SyncookiesFailed 649469
# HELP node_netstat_TcpExt_SyncookiesRecv Statistic TcpExtSyncookiesRecv.
# TYPE node_netstat_TcpExt_SyncookiesRecv untyped
node_netstat_TcpExt_SyncookiesRecv 6
# HELP node_netstat_TcpExt_SyncookiesSent Statistic TcpExtSyncookiesSent.
# TYPE node_netstat_TcpExt_SyncookiesSent untyped
node_netstat_TcpExt_SyncookiesSent 1.066903e+06
# HELP node_netstat_Tcp_ActiveOpens Statistic TcpActiveOpens.
# TYPE node_netstat_Tcp_ActiveOpens untyped
node_netstat_Tcp_ActiveOpens 6.176814e+06
# HELP node_netstat_Tcp_CurrEstab Statistic TcpCurrEstab.
# TYPE node_netstat_Tcp_CurrEstab untyped
node_netstat_Tcp_CurrEstab 3
# HELP node_netstat_Tcp_InErrs Statistic TcpInErrs.
# TYPE node_netstat_Tcp_InErrs untyped
node_netstat_Tcp_InErrs 8055
# HELP node_netstat_Tcp_PassiveOpens Statistic TcpPassiveOpens.
# TYPE node_netstat_Tcp_PassiveOpens untyped
node_netstat_Tcp_PassiveOpens 153244
# HELP node_netstat_Tcp_RetransSegs Statistic TcpRetransSegs.
# TYPE node_netstat_Tcp_RetransSegs untyped
node_netstat_Tcp_RetransSegs 1.5484305e+07
# HELP node_netstat_Udp6_InDatagrams Statistic Udp6InDatagrams.
# TYPE node_netstat_Udp6_InDatagrams untyped
node_netstat_Udp6_InDatagrams 0
# HELP node_netstat_Udp6_InErrors Statistic Udp6InErrors.
# TYPE node_netstat_Udp6_InErrors untyped
node_netstat_Udp6_InErrors 0
# HELP node_netstat_Udp6_NoPorts Statistic Udp6NoPorts.
# TYPE node_netstat_Udp6_NoPorts untyped
node_netstat_Udp6_NoPorts 0
# HELP node_netstat_Udp6_OutDatagrams Statistic Udp6OutDatagrams.
# TYPE node_netstat_Udp6_OutDatagrams untyped
node_netstat_Udp6_OutDatagrams 0
# HELP node_netstat_UdpLite6_InErrors Statistic UdpLite6InErrors.
# TYPE node_netstat_UdpLite6_InErrors untyped
node_netstat_UdpLite6_InErrors 0
# HELP node_netstat_UdpLite_InErrors Statistic UdpLiteInErrors.
# TYPE node_netstat_UdpLite_InErrors untyped
node_netstat_UdpLite_InErrors 0
# HELP node_netstat_Udp_InDatagrams Statistic UdpInDatagrams.
# TYPE node_netstat_Udp_InDatagrams untyped
node_netstat_Udp_InDatagrams 438554
# HELP node_netstat_Udp_InErrors Statistic UdpInErrors.
# TYPE node_netstat_Udp_InErrors untyped
node_netstat_Udp_InErrors 26683
# HELP node_netstat_Udp_NoPorts Statistic UdpNoPorts.
# TYPE node_netstat_Udp_NoPorts untyped
node_netstat_Udp_NoPorts 423094
# HELP node_netstat_Udp_OutDatagrams Statistic UdpOutDatagrams.
# TYPE node_netstat_Udp_OutDatagrams untyped
node_netstat_Udp_OutDatagrams 1.079029e+06
# HELP node_network_address_assign_type address_assign_type value of /sys/class/net/<iface>.
# TYPE node_network_address_assign_type gauge
node_network_address_assign_type{interface="eth0"} 0
node_network_address_assign_type{interface="lo"} 0
# HELP node_network_carrier carrier value of /sys/class/net/<iface>.
# TYPE node_network_carrier gauge
node_network_carrier{interface="eth0"} 1
node_network_carrier{interface="lo"} 1
# HELP node_network_carrier_changes_total carrier_changes_total value of /sys/class/net/<iface>.
# TYPE node_network_carrier_changes_total counter
node_network_carrier_changes_total{interface="eth0"} 2
node_network_carrier_changes_total{interface="lo"} 0
# HELP node_network_device_id device_id value of /sys/class/net/<iface>.
# TYPE node_network_device_id gauge
node_network_device_id{interface="eth0"} 0
node_network_device_id{interface="lo"} 0
# HELP node_network_dormant dormant value of /sys/class/net/<iface>.
# TYPE node_network_dormant gauge
node_network_dormant{interface="eth0"} 0
node_network_dormant{interface="lo"} 0
# HELP node_network_flags flags value of /sys/class/net/<iface>.
# TYPE node_network_flags gauge
node_network_flags{interface="eth0"} 4099
node_network_flags{interface="lo"} 9
# HELP node_network_iface_id iface_id value of /sys/class/net/<iface>.
# TYPE node_network_iface_id gauge
node_network_iface_id{interface="eth0"} 2
node_network_iface_id{interface="lo"} 1
# HELP node_network_iface_link iface_link value of /sys/class/net/<iface>.
# TYPE node_network_iface_link gauge
node_network_iface_link{interface="eth0"} 2
node_network_iface_link{interface="lo"} 1
# HELP node_network_iface_link_mode iface_link_mode value of /sys/class/net/<iface>.
# TYPE node_network_iface_link_mode gauge
node_network_iface_link_mode{interface="eth0"} 0
node_network_iface_link_mode{interface="lo"} 0
# HELP node_network_mtu_bytes mtu_bytes value of /sys/class/net/<iface>.
# TYPE node_network_mtu_bytes gauge
node_network_mtu_bytes{interface="eth0"} 1500
node_network_mtu_bytes{interface="lo"} 65536
# HELP node_network_net_dev_group net_dev_group value of /sys/class/net/<iface>.
# TYPE node_network_net_dev_group gauge
node_network_net_dev_group{interface="eth0"} 0
node_network_net_dev_group{interface="lo"} 0
# HELP node_network_protocol_type protocol_type value of /sys/class/net/<iface>.
# TYPE node_network_protocol_type gauge
node_network_protocol_type{interface="eth0"} 1
node_network_protocol_type{interface="lo"} 772
# HELP node_network_receive_bytes_total Network device statistic receive_bytes.
# TYPE node_network_receive_bytes_total counter
node_network_receive_bytes_total{device="eth0"} 8.141289755e+09
node_network_receive_bytes_total{device="lo"} 4.2463881e+08
# HELP node_network_receive_compressed_total Network device statistic receive_compressed.
# TYPE node_network_receive_compressed_total counter
node_network_receive_compressed_total{device="eth0"} 0
node_network_receive_compressed_total{device="lo"} 0
# HELP node_network_receive_drop_total Network device statistic receive_drop.
# TYPE node_network_receive_drop_total counter
node_network_receive_drop_total{device="eth0"} 0
node_network_receive_drop_total{device="lo"} 0
# HELP node_network_receive_errs_total Network device statistic receive_errs.
# TYPE node_network_receive_errs_total counter
node_network_receive_errs_total{device="eth0"} 0
node_network_receive_errs_total{device="lo"} 0
# HELP node_network_receive_fifo_total Network device statistic receive_fifo.
# TYPE node_network_receive_fifo_total counter
node_network_receive_fifo_total{device="eth0"} 0
node_network_receive_fifo_total{device="lo"} 0
# HELP node_network_receive_frame_total Network device statistic receive_frame.
# TYPE node_network_receive_frame_total counter
node_network_receive_frame_total{device="eth0"} 0
node_network_receive_frame_total{device="lo"} 0
# HELP node_network_receive_multicast_total Network device statistic receive_multicast.
# TYPE node_network_receive_multicast_total counter
node_network_receive_multicast_total{device="eth0"} 0
node_network_receive_multicast_total{device="lo"} 0
# HELP node_network_receive_packets_total Network device statistic receive_packets.
# TYPE node_network_receive_packets_total counter
node_network_receive_packets_total{device="eth0"} 7.030799e+07
node_network_receive_packets_total{device="lo"} 1.375153e+06
# HELP node_network_transmit_bytes_total Network device statistic transmit_bytes.
# TYPE node_network_transmit_bytes_total counter
node_network_transmit_bytes_total{device="eth0"} 5.6787879265e+10
node_network_transmit_bytes_total{device="lo"} 4.2463881e+08
# HELP node_network_transmit_carrier_total Network device statistic transmit_carrier.
# TYPE node_network_transmit_carrier_total counter
node_network_transmit_carrier_total{device="eth0"} 0
node_network_transmit_carrier_total{device="lo"} 0
# HELP node_network_transmit_colls_total Network device statistic transmit_colls.
# TYPE node_network_transmit_colls_total counter
node_network_transmit_colls_total{device="eth0"} 0
node_network_transmit_colls_total{device="lo"} 0
# HELP node_network_transmit_compressed_total Network device statistic transmit_compressed.
# TYPE node_network_transmit_compressed_total counter
node_network_transmit_compressed_total{device="eth0"} 0
node_network_transmit_compressed_total{device="lo"} 0
# HELP node_network_transmit_drop_total Network device statistic transmit_drop.
# TYPE node_network_transmit_drop_total counter
node_network_transmit_drop_total{device="eth0"} 0
node_network_transmit_drop_total{device="lo"} 0
# HELP node_network_transmit_errs_total Network device statistic transmit_errs.
# TYPE node_network_transmit_errs_total counter
node_network_transmit_errs_total{device="eth0"} 0
node_network_transmit_errs_total{device="lo"} 0
# HELP node_network_transmit_fifo_total Network device statistic transmit_fifo.
# TYPE node_network_transmit_fifo_total counter
node_network_transmit_fifo_total{device="eth0"} 0
node_network_transmit_fifo_total{device="lo"} 0
# HELP node_network_transmit_packets_total Network device statistic transmit_packets.
# TYPE node_network_transmit_packets_total counter
node_network_transmit_packets_total{device="eth0"} 9.2774181e+07
node_network_transmit_packets_total{device="lo"} 1.375153e+06
# HELP node_network_transmit_queue_length transmit_queue_length value of /sys/class/net/<iface>.
# TYPE node_network_transmit_queue_length gauge
node_network_transmit_queue_length{interface="eth0"} 1000
node_network_transmit_queue_length{interface="lo"} 1
# HELP node_network_up Valid operstate for interface.
# TYPE node_network_up gauge
node_network_up{address="00:00:00:00:00:00",broadcast="00:00:00:00:00:00",duplex="",ifalias="",interface="lo",operstate="unknown"} 0
node_network_up{address="00:16:3e:04:ea:13",broadcast="ff:ff:ff:ff:ff:ff",duplex="",ifalias="",interface="eth0",operstate="up"} 1
# HELP node_procs_blocked Number of processes blocked waiting for I/O to complete.
# TYPE node_procs_blocked gauge
node_procs_blocked 0
# HELP node_procs_running Number of processes in runnable state.
# TYPE node_procs_running gauge
node_procs_running 3
# HELP node_scrape_collector_duration_seconds node_exporter: Duration of a collector scrape.
# TYPE node_scrape_collector_duration_seconds gauge
node_scrape_collector_duration_seconds{collector="arp"} 0.000304651
node_scrape_collector_duration_seconds{collector="bcache"} 1.0697e-05
node_scrape_collector_duration_seconds{collector="bonding"} 1.8134e-05
node_scrape_collector_duration_seconds{collector="conntrack"} 1.2938e-05
node_scrape_collector_duration_seconds{collector="cpu"} 0.000284584
node_scrape_collector_duration_seconds{collector="diskstats"} 0.000102613
node_scrape_collector_duration_seconds{collector="edac"} 1.7804e-05
node_scrape_collector_duration_seconds{collector="entropy"} 2.3084e-05
node_scrape_collector_duration_seconds{collector="filefd"} 3.464e-05
node_scrape_collector_duration_seconds{collector="filesystem"} 0.000312891
node_scrape_collector_duration_seconds{collector="hwmon"} 2.359e-05
node_scrape_collector_duration_seconds{collector="infiniband"} 1.5962e-05
node_scrape_collector_duration_seconds{collector="ipvs"} 2.2402e-05
node_scrape_collector_duration_seconds{collector="loadavg"} 3.6675e-05
node_scrape_collector_duration_seconds{collector="mdadm"} 2.8429e-05
node_scrape_collector_duration_seconds{collector="meminfo"} 0.000238166
node_scrape_collector_duration_seconds{collector="netclass"} 0.000787465
node_scrape_collector_duration_seconds{collector="netdev"} 0.000162999
node_scrape_collector_duration_seconds{collector="netstat"} 0.000996904
node_scrape_collector_duration_seconds{collector="nfs"} 2.2407e-05
node_scrape_collector_duration_seconds{collector="nfsd"} 4.2902e-05
node_scrape_collector_duration_seconds{collector="sockstat"} 6.919e-05
node_scrape_collector_duration_seconds{collector="stat"} 0.000114657
node_scrape_collector_duration_seconds{collector="systemd"} 0.08496337
node_scrape_collector_duration_seconds{collector="textfile"} 7.163e-06
node_scrape_collector_duration_seconds{collector="time"} 2.2081e-05
node_scrape_collector_duration_seconds{collector="timex"} 1.0949e-05
node_scrape_collector_duration_seconds{collector="uname"} 1.3189e-05
node_scrape_collector_duration_seconds{collector="vmstat"} 0.000169744
node_scrape_collector_duration_seconds{collector="xfs"} 2.5948e-05
node_scrape_collector_duration_seconds{collector="zfs"} 0.000109579
# HELP node_scrape_collector_success node_exporter: Whether a collector succeeded.
# TYPE node_scrape_collector_success gauge
node_scrape_collector_success{collector="arp"} 1
node_scrape_collector_success{collector="bcache"} 1
node_scrape_collector_success{collector="bonding"} 1
node_scrape_collector_success{collector="conntrack"} 1
node_scrape_collector_success{collector="cpu"} 1
node_scrape_collector_success{collector="diskstats"} 1
node_scrape_collector_success{collector="edac"} 1
node_scrape_collector_success{collector="entropy"} 1
node_scrape_collector_success{collector="filefd"} 1
node_scrape_collector_success{collector="filesystem"} 1
node_scrape_collector_success{collector="hwmon"} 1
node_scrape_collector_success{collector="infiniband"} 1
node_scrape_collector_success{collector="ipvs"} 1
node_scrape_collector_success{collector="loadavg"} 1
node_scrape_collector_success{collector="mdadm"} 1
node_scrape_collector_success{collector="meminfo"} 1
node_scrape_collector_success{collector="netclass"} 1
node_scrape_collector_success{collector="netdev"} 1
node_scrape_collector_success{collector="netstat"} 1
node_scrape_collector_success{collector="nfs"} 1
node_scrape_collector_success{collector="nfsd"} 1
node_scrape_collector_success{collector="sockstat"} 1
node_scrape_collector_success{collector="stat"} 1
node_scrape_collector_success{collector="systemd"} 1
node_scrape_collector_success{collector="textfile"} 1
node_scrape_collector_success{collector="time"} 1
node_scrape_collector_success{collector="timex"} 1
node_scrape_collector_success{collector="uname"} 1
node_scrape_collector_success{collector="vmstat"} 1
node_scrape_collector_success{collector="xfs"} 1
node_scrape_collector_success{collector="zfs"} 1
# HELP node_sockstat_FRAG_inuse Number of FRAG sockets in state inuse.
# TYPE node_sockstat_FRAG_inuse gauge
node_sockstat_FRAG_inuse 0
# HELP node_sockstat_FRAG_memory Number of FRAG sockets in state memory.
# TYPE node_sockstat_FRAG_memory gauge
node_sockstat_FRAG_memory 0
# HELP node_sockstat_RAW_inuse Number of RAW sockets in state inuse.
# TYPE node_sockstat_RAW_inuse gauge
node_sockstat_RAW_inuse 0
# HELP node_sockstat_TCP_alloc Number of TCP sockets in state alloc.
# TYPE node_sockstat_TCP_alloc gauge
node_sockstat_TCP_alloc 14
# HELP node_sockstat_TCP_inuse Number of TCP sockets in state inuse.
# TYPE node_sockstat_TCP_inuse gauge
node_sockstat_TCP_inuse 9
# HELP node_sockstat_TCP_mem Number of TCP sockets in state mem.
# TYPE node_sockstat_TCP_mem gauge
node_sockstat_TCP_mem 6
# HELP node_sockstat_TCP_mem_bytes Number of TCP sockets in state mem_bytes.
# TYPE node_sockstat_TCP_mem_bytes gauge
node_sockstat_TCP_mem_bytes 24576
# HELP node_sockstat_TCP_orphan Number of TCP sockets in state orphan.
# TYPE node_sockstat_TCP_orphan gauge
node_sockstat_TCP_orphan 0
# HELP node_sockstat_TCP_tw Number of TCP sockets in state tw.
# TYPE node_sockstat_TCP_tw gauge
node_sockstat_TCP_tw 0
# HELP node_sockstat_UDPLITE_inuse Number of UDPLITE sockets in state inuse.
# TYPE node_sockstat_UDPLITE_inuse gauge
node_sockstat_UDPLITE_inuse 0
# HELP node_sockstat_UDP_inuse Number of UDP sockets in state inuse.
# TYPE node_sockstat_UDP_inuse gauge
node_sockstat_UDP_inuse 3
# HELP node_sockstat_UDP_mem Number of UDP sockets in state mem.
# TYPE node_sockstat_UDP_mem gauge
node_sockstat_UDP_mem 2
# HELP node_sockstat_UDP_mem_bytes Number of UDP sockets in state mem_bytes.
# TYPE node_sockstat_UDP_mem_bytes gauge
node_sockstat_UDP_mem_bytes 8192
# HELP node_sockstat_sockets_used Number of sockets sockets in state used.
# TYPE node_sockstat_sockets_used gauge
node_sockstat_sockets_used 146
# HELP node_systemd_system_running Whether the system is operational (see 'systemctl is-system-running')
# TYPE node_systemd_system_running gauge
node_systemd_system_running 0
# HELP node_systemd_unit_start_time_seconds Start time of the unit since unix epoch in seconds.
# TYPE node_systemd_unit_start_time_seconds gauge
node_systemd_unit_start_time_seconds{name="docker.service"} 0
node_systemd_unit_start_time_seconds{name="sshd.service"} 1.533292928693056e+09
# HELP node_systemd_unit_state Systemd unit
# TYPE node_systemd_unit_state gauge
node_systemd_unit_state{name="docker.service",state="activating"} 0
node_systemd_unit_state{name="docker.service",state="active"} 0
node_systemd_unit_state{name="docker.service",state="deactivating"} 0
node_systemd_unit_state{name="docker.service",state="failed"} 0
node_systemd_unit_state{name="docker.service",state="inactive"} 1
node_systemd_unit_state{name="sshd.service",state="activating"} 0
node_systemd_unit_state{name="sshd.service",state="active"} 1
node_systemd_unit_state{name="sshd.service",state="deactivating"} 0
node_systemd_unit_state{name="sshd.service",state="failed"} 0
node_systemd_unit_state{name="sshd.service",state="inactive"} 0
# HELP node_systemd_units Summary of systemd unit states
# TYPE node_systemd_units gauge
node_systemd_units{state="activating"} 0
node_systemd_units{state="active"} 110
node_systemd_units{state="deactivating"} 0
node_systemd_units{state="failed"} 4
node_systemd_units{state="inactive"} 80
# HELP node_textfile_scrape_error 1 if there was an error opening or reading a file, 0 otherwise
# TYPE node_textfile_scrape_error gauge
node_textfile_scrape_error 0
# HELP node_time_seconds System time in seconds since epoch (1970).
# TYPE node_time_seconds gauge
node_time_seconds 1.5547092776828244e+09
# HELP node_timex_estimated_error_seconds Estimated error in seconds.
# TYPE node_timex_estimated_error_seconds gauge
node_timex_estimated_error_seconds 8.6e-05
# HELP node_timex_frequency_adjustment_ratio Local clock frequency adjustment.
# TYPE node_timex_frequency_adjustment_ratio gauge
node_timex_frequency_adjustment_ratio 1.0000000045776367
# HELP node_timex_loop_time_constant Phase-locked loop time constant.
# TYPE node_timex_loop_time_constant gauge
node_timex_loop_time_constant 10
# HELP node_timex_maxerror_seconds Maximum error in seconds.
# TYPE node_timex_maxerror_seconds gauge
node_timex_maxerror_seconds 0.049128
# HELP node_timex_offset_seconds Time offset in between local system and reference clock.
# TYPE node_timex_offset_seconds gauge
node_timex_offset_seconds -7.4686e-05
# HELP node_timex_pps_calibration_total Pulse per second count of calibration intervals.
# TYPE node_timex_pps_calibration_total counter
node_timex_pps_calibration_total 0
# HELP node_timex_pps_error_total Pulse per second count of calibration errors.
# TYPE node_timex_pps_error_total counter
node_timex_pps_error_total 0
# HELP node_timex_pps_frequency_hertz Pulse per second frequency.
# TYPE node_timex_pps_frequency_hertz gauge
node_timex_pps_frequency_hertz 0
# HELP node_timex_pps_jitter_seconds Pulse per second jitter.
# TYPE node_timex_pps_jitter_seconds gauge
node_timex_pps_jitter_seconds 0
# HELP node_timex_pps_jitter_total Pulse per second count of jitter limit exceeded events.
# TYPE node_timex_pps_jitter_total counter
node_timex_pps_jitter_total 0
# HELP node_timex_pps_shift_seconds Pulse per second interval duration.
# TYPE node_timex_pps_shift_seconds gauge
node_timex_pps_shift_seconds 0
# HELP node_timex_pps_stability_exceeded_total Pulse per second count of stability limit exceeded events.
# TYPE node_timex_pps_stability_exceeded_total counter
node_timex_pps_stability_exceeded_total 0
# HELP node_timex_pps_stability_hertz Pulse per second stability, average of recent frequency changes.
# TYPE node_timex_pps_stability_hertz gauge
node_timex_pps_stability_hertz 0
# HELP node_timex_status Value of the status array bits.
# TYPE node_timex_status gauge
node_timex_status 8193
# HELP node_timex_sync_status Is clock synchronized to a reliable server (1 = yes, 0 = no).
# TYPE node_timex_sync_status gauge
node_timex_sync_status 1
# HELP node_timex_tai_offset_seconds International Atomic Time (TAI) offset.
# TYPE node_timex_tai_offset_seconds gauge
node_timex_tai_offset_seconds 0
# HELP node_timex_tick_seconds Seconds between clock ticks.
# TYPE node_timex_tick_seconds gauge
node_timex_tick_seconds 0.01
# HELP node_uname_info Labeled system information as provided by the uname system call.
# TYPE node_uname_info gauge
node_uname_info{domainname="(none)",machine="x86_64",nodename="iZwz91470vqghj98k5kqenZ",release="3.10.0-514.26.2.el7.x86_64",sysname="Linux",version="#1 SMP Tue Jul 4 15:04:05 UTC 2017"} 1
# HELP node_vmstat_pgfault /proc/vmstat information field pgfault.
# TYPE node_vmstat_pgfault untyped
node_vmstat_pgfault 1.67504549261e+11
# HELP node_vmstat_pgmajfault /proc/vmstat information field pgmajfault.
# TYPE node_vmstat_pgmajfault untyped
node_vmstat_pgmajfault 126855
# HELP node_vmstat_pgpgin /proc/vmstat information field pgpgin.
# TYPE node_vmstat_pgpgin untyped
node_vmstat_pgpgin 8.46847e+07
# HELP node_vmstat_pgpgout /proc/vmstat information field pgpgout.
# TYPE node_vmstat_pgpgout untyped
node_vmstat_pgpgout 8.05889033e+08
# HELP node_vmstat_pswpin /proc/vmstat information field pswpin.
# TYPE node_vmstat_pswpin untyped
node_vmstat_pswpin 0
# HELP node_vmstat_pswpout /proc/vmstat information field pswpout.
# TYPE node_vmstat_pswpout untyped
node_vmstat_pswpout 0
# HELP process_cpu_seconds_total Total user and system CPU time spent in seconds.
# TYPE process_cpu_seconds_total counter
process_cpu_seconds_total 1958.53
# HELP process_max_fds Maximum number of open file descriptors.
# TYPE process_max_fds gauge
process_max_fds 1024
# HELP process_open_fds Number of open file descriptors.
# TYPE process_open_fds gauge
process_open_fds 8
# HELP process_resident_memory_bytes Resident memory size in bytes.
# TYPE process_resident_memory_bytes gauge
process_resident_memory_bytes 2.0525056e+07
# HELP process_start_time_seconds Start time of the process since unix epoch in seconds.
# TYPE process_start_time_seconds gauge
process_start_time_seconds 1.55412590705e+09
# HELP process_virtual_memory_bytes Virtual memory size in bytes.
# TYPE process_virtual_memory_bytes gauge
process_virtual_memory_bytes 1.17321728e+08
# HELP process_virtual_memory_max_bytes Maximum amount of virtual memory available in bytes.
# TYPE process_virtual_memory_max_bytes gauge
process_virtual_memory_max_bytes -1
# HELP promhttp_metric_handler_requests_in_flight Current number of scrapes being served.
# TYPE promhttp_metric_handler_requests_in_flight gauge
promhttp_metric_handler_requests_in_flight 1
# HELP promhttp_metric_handler_requests_total Total number of scrapes by HTTP status code.
# TYPE promhttp_metric_handler_requests_total counter
promhttp_metric_handler_requests_total{code="200"} 0
promhttp_metric_handler_requests_total{code="500"} 0
promhttp_metric_handler_requests_total{code="503"} 0
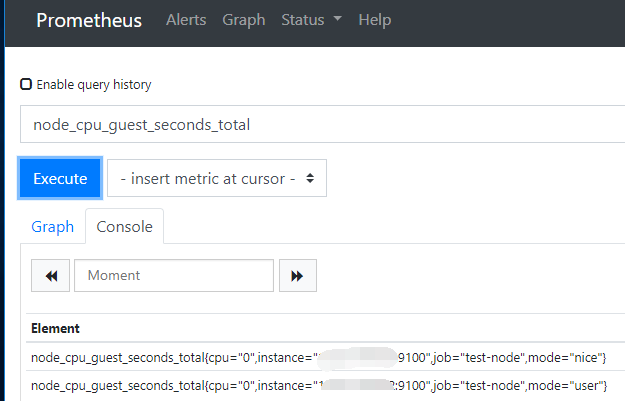
使用PromQL可以查看 node_exporter 插件监控的数据
cpu使用率: 100-(avg(irate(node_cpu_seconds_total{mode="idle"}[5m])) by(instance) *100)
内存使用率:100-(node_memory_MemFree_bytes+node_memory_Buffers_bytes+node_memory_Cached_bytes)/node_memory_MemTotal_bytes*100
硬盘使用率:100-node_filesystem_free_bytes{mountpoint="/",fstype=~"ext4|rootfs"}/node_filesystem_size_bytes{mountpoint="/",fstype=~"ext4|rootfs"}*100
监控systemctl管理的系统服务运行状态
# ./node_exporter --collector.systemd --collector.systemd.unit-whitelist=(logstash|docker|sshd).service
PromQL查询node_systemd_unit_state可以看到服务的运行状态
textfile collector
可以自定义metrics, 类似于pushgateway。
1. node_exporter启动时添加参数--collector.textfile.directory=dir,指定文本文件收集路径
2. node_exporter会从这个目录读取后缀为.prom文件的数据。
3. prometheus server从node_exporter中pull拉取监控数据。
eg:
先使用prometheus_client 往.prom文件里面写一条数据。如下:
from prometheus_client import CollectorRegistry, Gauge, write_to_textfile

registry = CollectorRegistry()
g = Gauge('test_metric', 'this is a test metric',["label1","label2"],registry=registry)
#注:如果没有写HELP和TYPE的话,系统会帮助生成一个简单的HELP描述和TYPE类型
g.labels(label1="string1",label2="string2").set(4)
write_to_textfile('/usr/local/node_exporter/conf/test.prom', registry)
文件内容:
# cat test.prom
# HELP test_metric this is a test metric
# TYPE test_metric gauge
test_metric{label1="string1",label2="string2"} 4.0
启动node_exporter,访问ip:9100/metrics可以看到这条数据。
注意:如果有多个文件中出现相同的指标名称(example_metric),需要保证这些指标的HELP和TYPE都一致,否则采集将出错. 基本格式也可以参考node_exporter/metrics路径下显示的内容.
如果需要增加多条数据到.prom文件,需要先 Guag,注意一个metrics不能注册多次,否则会报错
g = Gauge('test_metric', 'this is a test metric',["label1"],registry=registry)
g.labels(label1="string1").set(4)
g2 = Gauge('test_metric', 'another test metric',["label1"],registry=registry)
g2.labels(label1="string11").set(5)
write_to_textfile('test.prom', registry)
#执行报错:
ValueError: Duplicated timeseries in CollectorRegistry: {'test_metric'}
正确:
g = Gauge('test_metric', 'this is a test metric',["label1"],registry=registry)
g.labels(label1="string1").set(4)
g.labels(label1="string11").set(5)
write_to_textfile('test.prom', registry)
#查看结果
$ cat test.prom
# HELP test_metric this is a test metric
# TYPE test_metric gauge
test_metric{label1="string1"} 4.0
test_metric{label1="string11"} 5.0
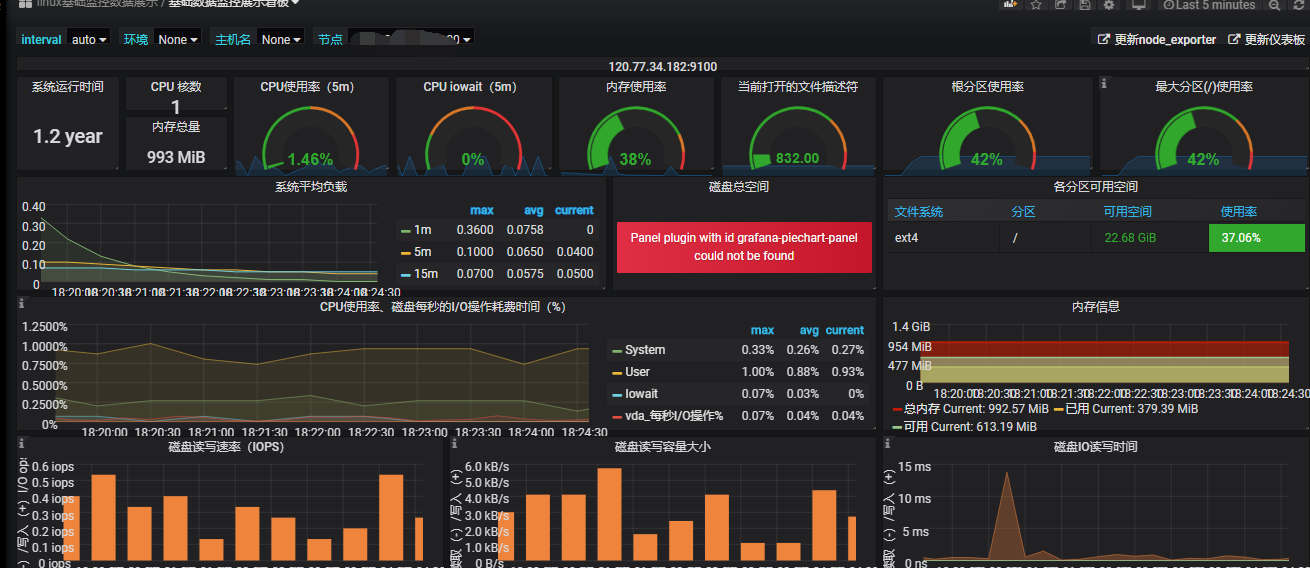
grafana web展示
首先安装运行grafana,这里为了简便直接使用docker运行
# docker run -d --name=grafana -p 3000:3000 grafana/grafana
访问ip:3000 ,
1,在DataSource里面选择数据源类型 prometheus,然后配置prometheus的访问地址。
2,在dashboard中import :https://grafana.com/dashboards/8919,grafana提供了很多现成的dashboard可以直接导入id或者url