1 问题描述
matploglib 能够绘制出精美的图表, 有些时候, 我们希望把一组图放在一起进行比较, 有没有什么好的方法呢?
matplotlib 中提供的 subplot 可以很好的解决这个问题
2 subplot函数介绍
matplotlib下, 一个 Figure 对象可以包含多个子图(Axes), 可以使用 subplot() 快速绘制, 其调用形式如下 :
subplot(numRows, numCols, plotNum)- 1
-
图表的整个绘图区域被分成
numRows行和numCols列 -
然后按照从左到右,从上到下的顺序对每个子区域进行编号,左上的子区域的编号为1
-
plotNum参数指定创建的Axes对象所在的区域
如果 numRows = 2, numCols = 3, 那整个绘制图表样式为 2X3 的图片区域, 用坐标表示为
(1, 1), (1, 2), (1, 3)
(2, 1), (2, 2), (2, 3)- 1
- 2
这时, 当 plotNum = 3 时, 表示的坐标为(1, 3), 即第一行第三列的子图
-
如果
numRows,numCols和plotNum这三个数都小于10的话, 可以把它们缩写为一个整数, 例如subplot(323)和subplot(3,2,3)是相同的. -
subplot在plotNum指定的区域中创建一个轴对象. 如果新创建的轴和之前创建的轴重叠的话,之前的轴将被删除.
3 示例程序
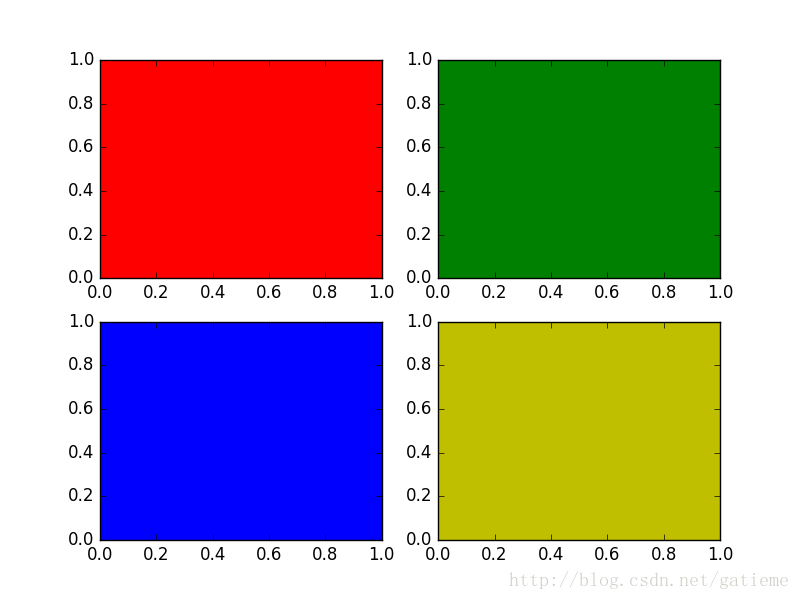
3.1 规则划分成3*3的
#!/usr/bin/env python
#!encoding=utf-8

import matplotlib
import matplotlib.pyplot as plt

if __name__ == '__main__':
    for i,color in enumerate("rgby"):
        plt.subplot(221+i, axisbg=color)

plt.show()- 1
- 2
- 3
- 4
- 5
- 6
- 7
- 8
- 9
- 10
- 11
3.2 不规则划分
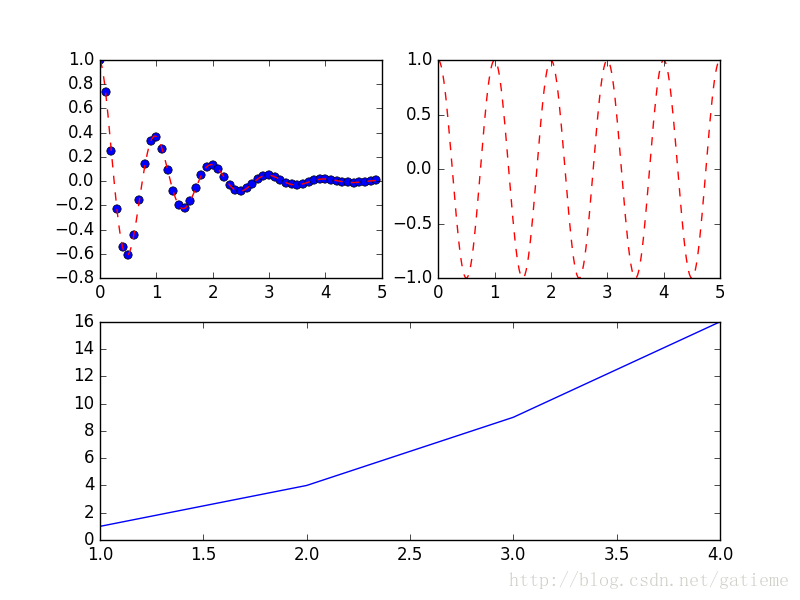
但是有时候我们的划分并不是规则的, 比如如下的形式
这种应该怎么划分呢?
将整个表按照 2*2 划分
前两个简单, 分别是 (2, 2, 1) 和 (2, 2, 2)
但是第三个图呢, 他占用了 (2, 2, 3) 和 (2, 2, 4)
显示需要对其重新划分, 按照 2 * 1 划分
前两个图占用了 (2, 1, 1) 的位置
因此第三个图占用了 (2, 1, 2) 的位置

代码如下, 参照matplotlib绘制多个子图——subplot
#!/usr/bin/env python
#!encoding=utf-8

import matplotlib.pyplot as plt
import numpy as np


def f(t):
    return np.exp(-t) * np.cos(2 * np.pi * t)

if __name__ == '__main__' :
    t1 = np.arange(0, 5, 0.1)
    t2 = np.arange(0, 5, 0.02)

    plt.figure(12)
    plt.subplot(221)
    plt.plot(t1, f(t1), 'bo', t2, f(t2), 'r--')

    plt.subplot(222)
    plt.plot(t2, np.cos(2 * np.pi * t2), 'r--')

    plt.subplot(212)
    plt.plot([1, 2, 3, 4], [1, 4, 9, 16])

    plt.show()