一、任务基础
泰坦尼克号沉没是历史上最著名的沉船事故之一。1912年4月15日,在她的处女航中,泰坦尼克号在与冰山相撞后沉没,在2224名乘客和机组人员中造成1502人死亡。这场耸人听闻的悲剧震惊了国际社会,并为船舶制定了更好的安全规定。造成海难失事的原因之一是乘客和机组人员没有足够的救生艇。尽管幸存下沉有一些运气因素,但有些人比其他人更容易生存,例如妇女,儿童和上流社会。在这个案例中我们将运用机器学习来预测哪些乘客可以幸免于悲剧。
数据集链接:https://pan.baidu.com/s/1bVnIM5JVZjib1znZIDn10g 。提取码:1htm 。
读取titanic_train数据集
import pandas
# 读取数据集
titanic = pandas.read_csv('titanic_train.csv')
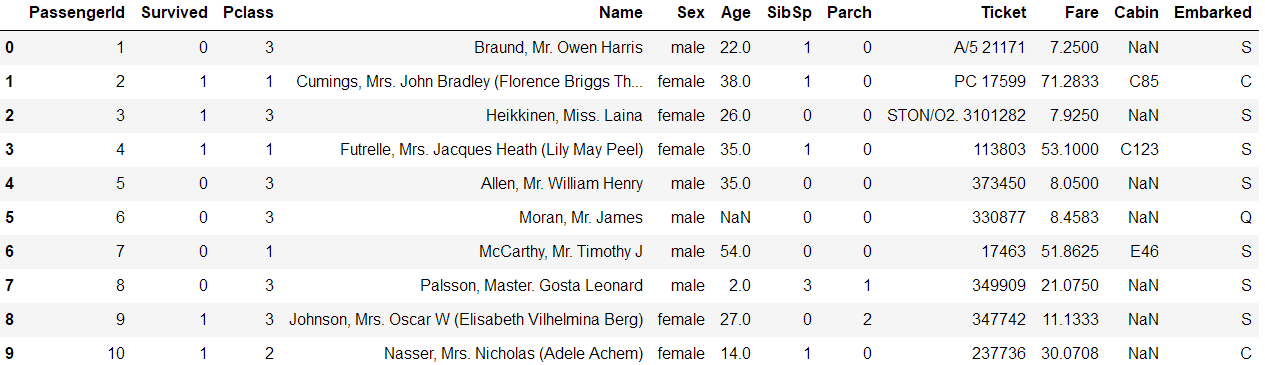
titanic.head(10)
查看数据集前10行
特征名词解释
| 特征名称 | 特征解释 |
| PassengerId | 乘客id,对结果没有影响 |
| Survived | 1表示存活,0表示未存活 |
| Pclass | 船舱等级,越有钱船舱等级越高,所以对结果有影响 |
| Name | 乘客名字,先暂时认为对结果没有影响 |
| Sex | 性别,毫无疑问,女生优先,所以肯定对结果有影响 |
| Age | 年龄,不用说这列也有影响 |
| SibSp | 兄弟姐妹,对结果也有影响 |
| Parch | 父母和小孩,不用说也有影响 |
| Ticket | 票的编号,貌似没啥影响 |
| Fare | 船票价格,和船舱等级一样,不能忽略 |
| Cabin | 船舱号,应该也没啥影响 |
| Embarked | 登船地点,不同地点登船可能身份不一样 |
二、数据预处理
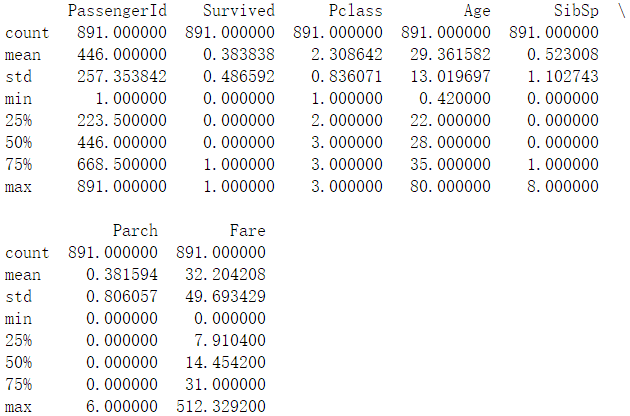
可以看到Age列有缺失值(NaN)。一般来说,数据发生缺失的话有两种处理方法,一种填充缺失值,一种直接舍弃这个特征。这里一般来说Age对结果是有较大影响的,我们可以对缺失值进行填充,这里可以填充平均值 。
# Age 缺失值填充
titanic['Age'] = titanic['Age'].fillna(titanic['Age'].median())
print(titanic.describe())
填充后查看数据集的描述
机器学习算法一般来说解决不了对字符的分类。因为我们是要对Survived这列‘’0‘’和"1"进行分类嘛。所以我们就要把"Sex"这一列的数据进行处理,把它映射为数值型。那我们就把"male"和“female”进行处理,分别用0和1替代。
# print(titanic['Sex'].unique())

# Replace all the occurences of male with the number 0.
# 用数字0替换所有出现的男性。
titanic.loc[titanic["Sex"] == "male", "Sex"] = 0
titanic.loc[titanic["Sex"] == "female", "Sex"] = 1
同时,我们也把"Embarked"这一列数据进行同样的处理
# print(titanic['Embarked'].unique())

# Embarked:上船港口,有三个取值,C/S/Q,是文字形式,不利于分析,
# 故可能需要映射到数值的值,而且有2个缺失值
titanic['Embarked'] = titanic['Embarked'].fillna('S') # 缺失值填充为这一列的众数'S'
titanic.loc[titanic["Embarked"] == "S", "Embarked"] = 0
titanic.loc[titanic["Embarked"] == "C", "Embarked"] = 1
titanic.loc[titanic["Embarked"] == "Q", "Embarked"] = 2
三、分类任务
首先使用线性回归算法来进行分类
# Import the linear regression(回归) class
# 注意不要导错库
from sklearn.linear_model import LinearRegression
from sklearn.model_selection import KFold

# The columns we'll use to predict the target
predictors = ['Pclass', 'Sex', 'Age', 'SibSp', 'Parch', 'Fare', 'Embarked']

# Initialize our algorithm class
alg = LinearRegression()

# Generate cross validation folds for the titanic dataset. It return the row indices
# corresponding(相应的) to train and test.
# 为Titanic数据集生成交叉验证折叠。它返回与训练和测试相对应的行索引。
# We set random_state to ensure we get the same splits every time we run this.
# kf = KFold(titanic.shape[0], n_folds=3, random_state=1) 写法错误已被弃用

# 样本平均分成3份,3折交叉验证
kf = KFold(n_splits=3,shuffle=False, random_state=1)

# 注意这里不是kf.split(titanic.shape[0]),会报如下错误:
# Singleton array array(891) cannot be considered a valid collection.

predictions = []
# 交叉验证 划分训练集 验证集
for train, test in  kf.split(titanic):
    # The predictors we're using the train the algorithm. Note how we only take
    # the rows in the train folds
    # 注意我们只得到训练集的rows
    train_predictors = titanic[predictors].iloc[train, :]
    # The target we're using to train the algorithm.
    train_target = titanic['Survived'].iloc[train]
    # Training the algorithm using the predictors and target
    alg.fit(train_predictors, train_target)
    # We can now make predictions on the test fold
    test_predictions = alg.predict(titanic[predictors].iloc[test, :])
    predictions.append(test_predictions)
查看线性回归准确率
import numpy as np

# The predictions are in three separate numpy arrays. Concatenate them into one.
# We concatenate them on asix 0, as they only have one axis.
predictions = np.concatenate(predictions,axis=0)

# Map predictions to outcomes (only possible outcomes are 1 and 0)
predictions[predictions > .5] = 1  # 映射成分类结果 计算准确率
predictions[predictions <= .5] = 0

# 注意这一行与源代码有出入
accuracy = sum(predictions==titanic['Survived'])/len(predictions)

# 验证集的准确率
print(accuracy)
得到的准确率为
0.7833894500561167
对于一个二分类问题来说,这个准确率似乎不太行,接下来用逻辑回归算法试下
from sklearn.model_selection import cross_val_score
from sklearn.linear_model import LogisticRegression

alg = LogisticRegression(random_state=1)
# Compute the accuracy score for all the cross validation folds,
# (much simper than what we did before!)
scores = cross_val_score(alg, titanic[predictors], titanic["Survived"], cv=3)
# Take the mean of the scores (because we have one for each fold)
print(scores.mean())
得到的准确率为,可以发现效果要好了一点。
0.8047138047138048
上面得到的结果都是对交叉验证后的验证集来进行分类,在实际结果中,应该使用测试数据集来进行分类。
读取测试数据集并填充数据集,然后进行数值映射,与上面类似。
titanic_test = pandas.read_csv("test.csv")
titanic_test["Age"] = titanic_test["Age"].fillna(titanic["Age"].median())
titanic_test["Fare"] = titanic_test["Fare"].fillna(titanic_test["Fare"].median())
titanic_test.loc[titanic_test["Sex"] == "male", "Sex"] = 0
titanic_test.loc[titanic_test["Sex"] == "female", "Sex"] = 1
titanic_test["Embarked"] = titanic_test["Embarked"].fillna("S")

titanic_test.loc[titanic_test["Embarked"] == "S", "Embarked"] = 0
titanic_test.loc[titanic_test["Embarked"] == "C", "Embarked"] = 1
titanic_test.loc[titanic_test["Embarked"] == "Q", "Embarked"] = 2
通过上面发现,似乎线性回归,逻辑回归这类算法似乎不太行,那这次再用随机森林算法来试下(一般来说随机森林算法比线性回归和逻辑回归算法的效果好一点),注意随机森林参数的变化。
from sklearn.model_selection import cross_val_score
from sklearn.model_selection import KFold
from sklearn.ensemble import RandomForestClassifier

predictors = ["Pclass", "Sex", "Age", "SibSp", "Parch", "Fare", "Embarked"]

# Initialize our algorithm with the default paramters
# n_estimators is the number of trees we want to make
# min_samples_split is the minimum number of rows we need to make a split
# min_samples_leaf is the minimum number of samples we can have at the place where a
# tree branch(分支) ends (the bottom points of the tree)
alg = RandomForestClassifier(random_state=1,
                             n_estimators=10,
                             min_samples_split=2,
                             min_samples_leaf=1)
# Compute the accuracy score for all the cross validation folds.  (much simpler than what we did before!)
kf = KFold(n_splits=3, shuffle=False, random_state=1)
scores = cross_val_score(alg, titanic[predictors], titanic["Survived"], cv=kf)

# Take the mean of the scores (because we have one for each fold)
print(scores.mean())
准确率为:
0.7856341189674523
发现准确率还是不太行。在机器学习中,调整参数也是非常重要的,一般通过参数的调整来对模型进行优化。这次调整随机森林的参数。
alg = RandomForestClassifier(random_state=1,
                             n_estimators=100,
                             min_samples_split=4,
                             min_samples_leaf=2)
# Compute the accuracy score for all the cross validation folds.  (much simpler than what we did before!)
kf = KFold(n_splits=3, shuffle=False, random_state=1)
scores = cross_val_score(alg, titanic[predictors], titanic["Survived"], cv=kf)

# Take the mean of the scores (because we have one for each fold)
print(scores.mean())
得到的准确率为:
0.8148148148148148
未完待续。。。