1. show global status 查看所有状态 (可省略)
2. SHOW VARIABLES LIKE 'max_connections' (查找最大连接数),然后修改 my.cnf 文件中 max_connections 的值 为1500
3.重启mysql sudo service mysql restart
4.查看是否有死锁 show processlist
5.开启慢查询
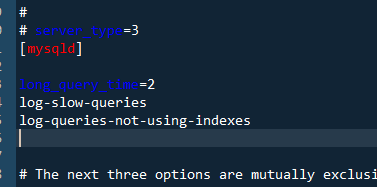
1)在my.cnf(或者my.ini) 文件下,搜索 mysqld,然后在其下行 添加
long_query_time=2
log-slow-queries
log-queries-not-using-indexes
2)确认慢查询开启
show variables like '%slow%';
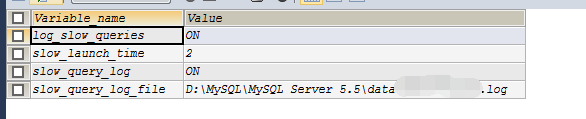
(如果没有开启的话 set global slow_query_log = ON;)
3) 使用mysql 自带命令查询慢查询日志
mysqldumpslow -s c -t 20 /var/lib/mysql/s0-slow.log (参考 http://www.cnblogs.com/lavandachen/articles/1929537.html )
6.explain分析查询
用法 :在语句前加 explain 例如 explain select * from table (作用 http://blog.csdn.net/kennyrose/article/details/7532032 )
用法 http://www.cnblogs.com/linjiqin/p/4125898.html
创建与删除索引 http://blog.csdn.net/yuanzhuohang/article/details/6497021
7. profiling 分析查询
通过慢日志查询可以知道哪些SQL语句执行效率低下,通过explain我们可以得知SQL语句的具体执行情况,索引使用等,还可以结合show命令查看执行状态。
如果觉得explain的信息不够详细,可以同通过profiling命令得到更准确的SQL执行消耗系统资源的信息。
http://www.2cto.com/database/201506/404310.html
show profiles;
8.其他扩展
http://blog.csdn.net/iquicksandi/article/details/7970706
最重要
show variables like 'max_connections';
set global max_connections=1500;
连接数 慢查询 索引 锁表问题 基本数据库最大问题
然后查看日志 内存溢出
9. linux安装mysql
http://jingyan.baidu.com/article/425e69e6bbc6c7be14fc1640.html 教程
sudo apt-get install mysql-server mysql-client
sudo service mysql restart
端口查看
netstat -ntlp
3306 mysql
授权
http://jingyan.baidu.com/article/ea24bc398522b3da62b331d3.html
my.cnf
find / -name my.cnf
/etc/mysql
mysql
mysql
grant all privileges on *.* to 'root'@'%' identified by '123123';