Prometheus简介
Prometheus是最初在SoundCloud上构建的开源系统监视和警报工具包。 自2012年成立以来,许多公司和组织都采用了Prometheus,该项目拥有非常活跃的开发人员和用户社区。它是一个独立的开源项目,并且独立于任何公司进行维护。 为了强调这一点并阐明项目的治理结构,Prometheus在2016年加入了Cloud Native Computing Foundation,这是继Kubernetes之后的第二个托管项目。
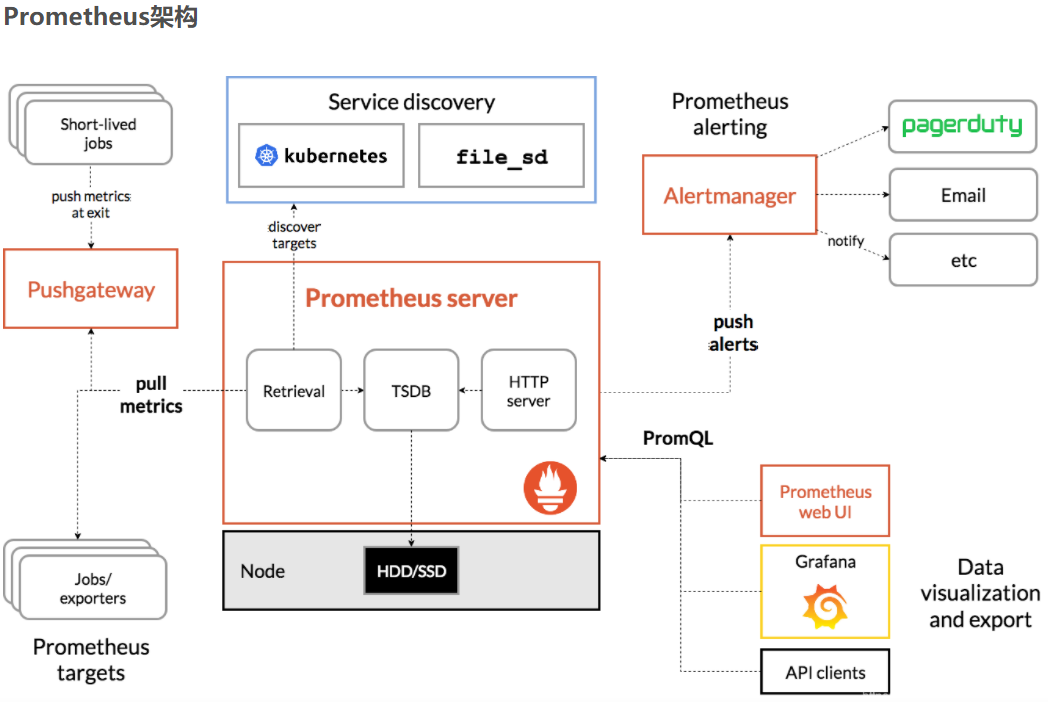
Prometheus服务,可以直接通过目标拉取数据,或者间接地通过中间网关拉取数据。它在本地存储抓取的所有数据,并对这些数据运行规则,以汇总和记录现有数据中的新时间序列,或生成警报。 Grafana或其他API使用者可用于可视化收集的数据。
组件
服务器抓取并存储时间序列数据客户端库以检测应用程序代码
一个支持短暂工作的推送网关
支持以下HAProxy,StatsD,Graphite等服务接口
告警
大多数Prometheus组件都是用Go编写的,因此易于构建和部署为静态二进制文件。
场景
适用场景
Prometheus非常适合记录任何纯数字时间序列。它既适用于面向服务器等硬件指标的监控,也适合于高度动态的面向服务的体系结构的监视。 在微服务世界中,它对多维数据收集和查询的支持是一种特别的优势。
Prometheus的设计旨在提高可靠性,使其成为中断期间要使用的系统,以使您能够快速诊断问题。 每个Prometheus服务器都是独立的,而不依赖于网络存储或其他远程服务。 当服务出现故障时,它可以使你快速定位和诊断问题。它的搭建过程对硬件和服务没有很强的依赖关系
不适用场景
Prometheus,主要在于可靠性,在很恶劣的环境下,都可以随时访问它和查看系统服务各种指标的统计信息。 如果你对统计数据需要100%的精确,它并不适用,例如:实时计费系统
安装方式
二进制)
1.获取源码包
 wget https://github.com/prometheus/prometheus/releases/download/v2.17.1/prometheus-2.17.1.linux-amd64.tar.gz
  国内镜像
wget https://mirrors.tuna.tsinghua.edu.cn/github-release/prometheus/prometheus/2.17.1%20_%202020-03-26/prometheus-2.17.1.linux-amd64.tar.gz
2.解压,运行
tar zxvf prometheus*.gz


默认启动占用9090端口,开启防火墙
firewall-cmd --add-port=9090/tcp --permanent
firewall-cmd --reload


启动
./prometheus --config.file=prometheus.yml
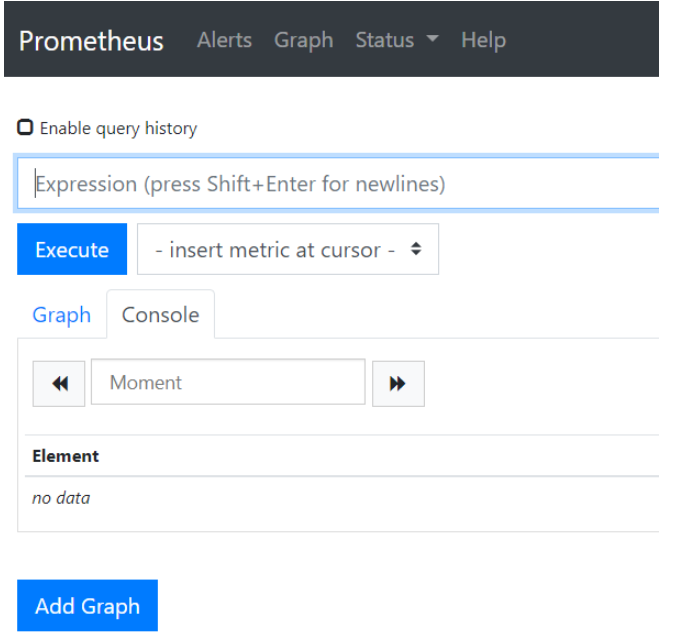
3.输入ip:9090即可访问
Docker)
后台运行:
1)后台运行&
./prometheus --config.file=prometheus.yml --web.enable-lifecycle > /prometheus.log 2>&1 &
2)systemctl方式
新增prometheus.service
[Unit]
Description=prometheus
Documentation=https://prometheus.io/docs/introduction/overview/
After=network.target

[Service]
#User=root
#Group=root
Type=simple
# 启动脚本
ExecStart=/opt/prometheus-2.30.1.linux-amd64/prometheus
  --config.file=/opt/prometheus-2.30.1.linux-amd64/prometheus.yml
  --web.enable-lifecycle
ExecReload=/bin/kill -HUP $MAINPID
Restart=on-failure
[Install]
WantedBy=multi-user.target
重新加载配置
systemctl daemon-reload
开机启动
systemctl enable prometheus.service
启动服务
systemctl start prometheus.service

查看启动状态
systemctl status prometheus
热加载
Prometheus配置信息的热加载有两种方式:
第一种热加载方式:查看Prometheus的进程id,发送SIGHUP信号:
kill -HUP <pid>
第二种热加载方式:发送一个POST请求到/-/reload,需要在启动时给定--web.enable-lifecycle选项:
curl -X POST http://localhost:9090/-/reload
如果配置热加载成功,Prometheus会打印出下面的log:
msg="Loading configuration file" filename=prometheus.yml