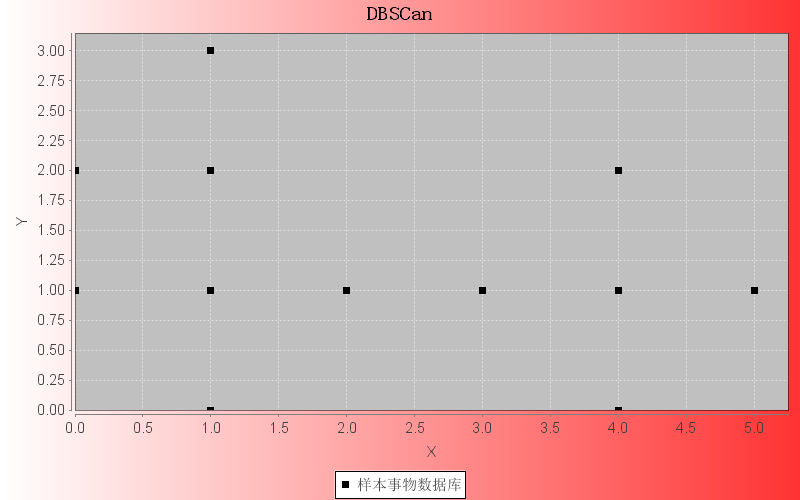
代码如下
 View Code
import java.awt.Color;
import java.awt.Font;
import java.awt.GradientPaint;
import java.io.File;
import java.io.IOException;

import org.jfree.chart.ChartFactory;
import org.jfree.chart.ChartFrame;
import org.jfree.chart.ChartUtilities;
import org.jfree.chart.JFreeChart;
import org.jfree.chart.StandardChartTheme;
import org.jfree.chart.plot.PlotOrientation;
import org.jfree.chart.plot.XYPlot;
import org.jfree.data.xy.XYSeries;
import org.jfree.data.xy.XYSeriesCollection;


public class DBscan {

    /**
     * @param args
     */
    public static void main(String[] args) {
        // TODO Auto-generated method stub
        XYSeries xyseries = new XYSeries("样本事物数据库");
        xyseries.add(1, 0);
        xyseries.add(4, 0);
        xyseries.add(0, 1);
        xyseries.add(1, 1);
        xyseries.add(2, 1);
        xyseries.add(3, 1);
        xyseries.add(4, 1);
        xyseries.add(5, 1);
        xyseries.add(0,2);
        xyseries.add(1,2);
        xyseries.add(4,2);
        xyseries.add(1,3);


        XYSeriesCollection xyseriescollection = new XYSeriesCollection(); //再用XYSeriesCollection添加入XYSeries 对象
        xyseriescollection.addSeries(xyseries);

        //创建主题样式
        StandardChartTheme standardChartTheme=new StandardChartTheme("CN");
        //设置标题字体
        standardChartTheme.setExtraLargeFont(new Font("隶书",Font.BOLD,20));
        //设置图例的字体
        standardChartTheme.setRegularFont(new Font("宋书",Font.PLAIN,15));
        //设置轴向的字体
        standardChartTheme.setLargeFont(new Font("宋书",Font.PLAIN,15));
        //应用主题样式
        ChartFactory.setChartTheme(standardChartTheme);
        //JFreeChart chart=ChartFactory.createXYAreaChart("xyPoit", "点的标号", "出现次数", xyseriescollection, PlotOrientation.VERTICAL, true, false, false);
        JFreeChart chart=ChartFactory.createScatterPlot("DBSCan", "X", "Y", xyseriescollection, PlotOrientation.VERTICAL, true, false, false);
        // 设置背景色为渐变色
        chart.setBackgroundPaint(new GradientPaint(0,0,Color.white,1000,0,Color.red));
        XYPlot plot = chart.getXYPlot();
//        前景色通明度
        plot.setForegroundAlpha(1.0f);
//        设置点的颜色
    //    plot.getRenderer().setSeriesPaint(0, new Color(60,50,50)) ;
        plot.getRenderer().setSeriesPaint(0, Color.black) ;

                try {
                    ChartUtilities.saveChartAsPNG(new File("E:/chart/BarChart3D.png"), chart, 800, 500);
                } catch (IOException e) {
                    // TODO Auto-generated catch block
                    e.printStackTrace();
                }

        ChartFrame ChartFrame = new ChartFrame("水果产量图",chart);
        ChartFrame.pack();
        //ChartFrame.setFont(new Font("宋体",Font.BOLD,20));
        ChartFrame.setVisible(true);
        System.out.println("绘图完成");

    }

}
