GPU Debugger
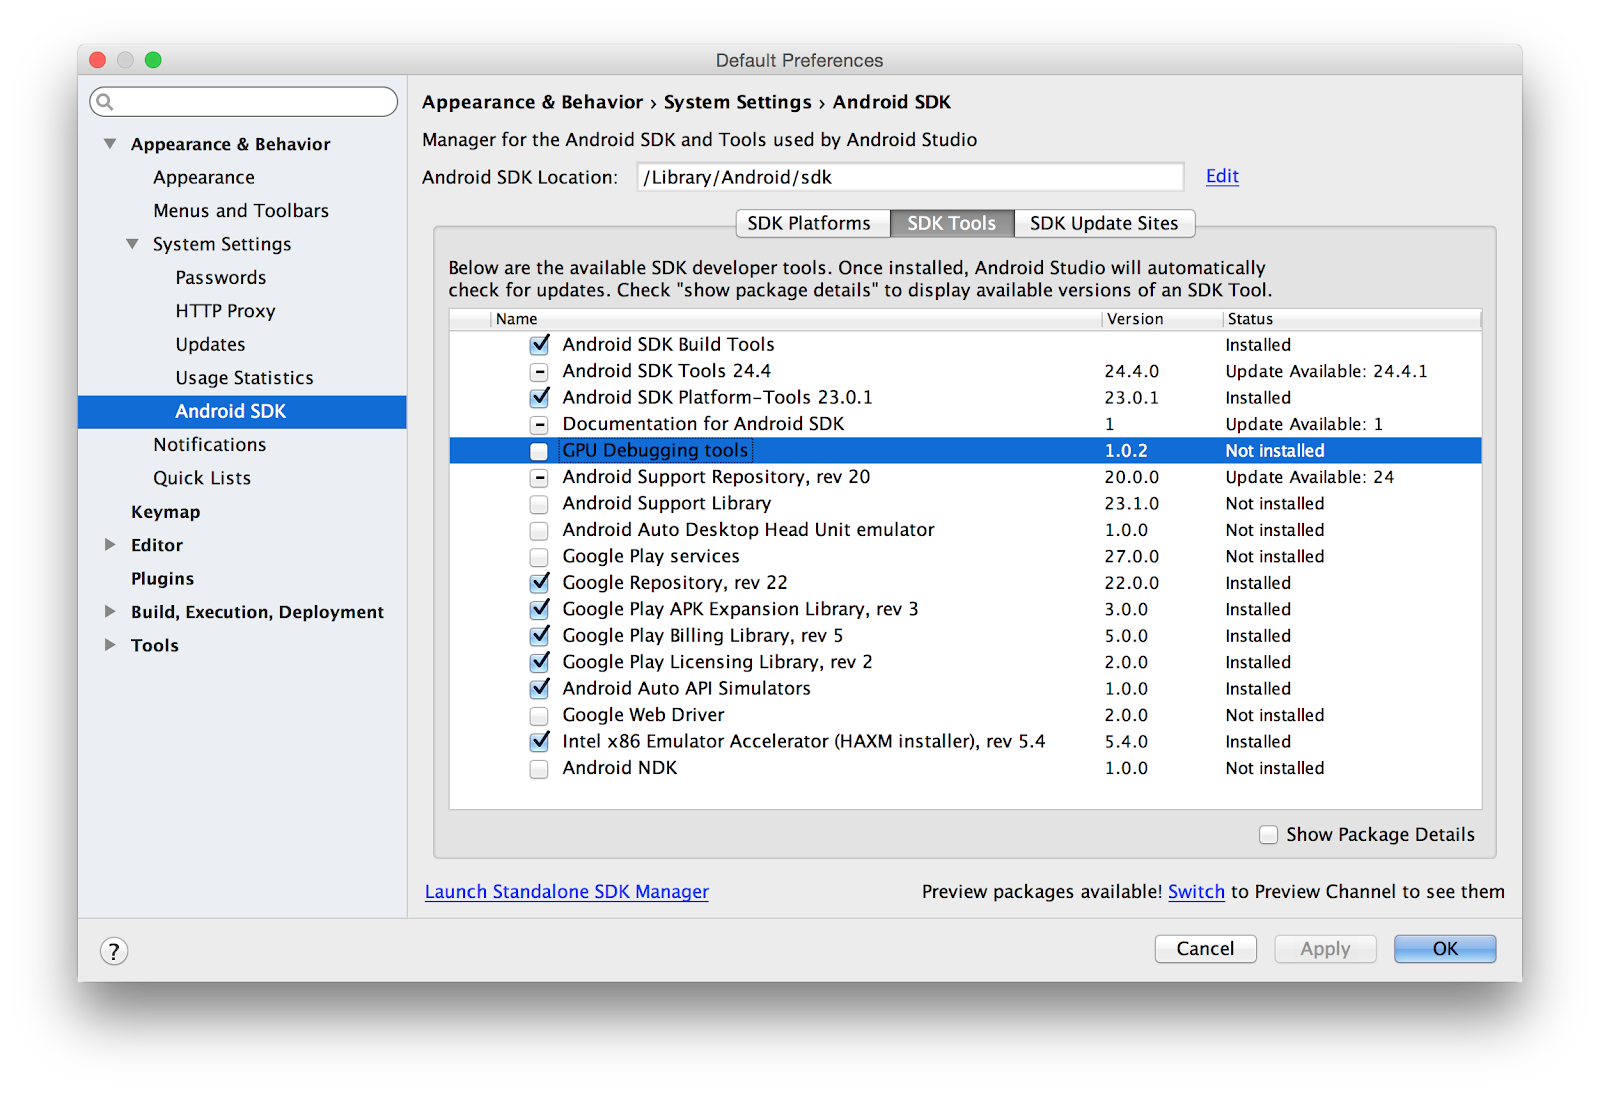
GPU Debugging ToolsThe GPU debugging tools are an experimental feature intended to help inspect GPU state and understand what caused a specific rendering outcome. Installing the GPU Debugging ToolsThe GPU Debugging Tools are not installed by default; you’ll need to add it before you can use it. You can find them in the SDK tools section of your SDK manager: Adding the trace library to your applicationIn order to use the profiler, you need to load the trace library in your application. The correct way to load the library depends on whether your code is C++ or Java. The library can be loaded via either method in a hybrid app. Regardless of which way you load the library, you first need to copy it into your project so that it can be loaded. The trace library will be located inside your SDK installation. You can find your SDK installation path location listed at the top of your SDK Manager. The libraries will be located in <sdkDir>/extras/android/gapid/android/<abi>/libgapii.so. You need to copy the relevant abi folders into your project’s jniLibs directory. This will be at <projectDir>/app/src/main/jniLibs. If it doesn’t already exist, you should create it. Like the SDK manager folder, jniLibs should contain one folder per ABI that you plan to support. If you don’t know which ABIs you plan to support, you can copy all of the folders. Your final project directory structure should look like <projectDir>/app/src/main/jniLibs/<abi>/libgappii.so. Loading the trace library in native codeTo load the trace library in native code, create a .cpp file containing this snippet:
Loading the trace library in Java codeTo load the trace library into Java code, insert this snippet into your main class:
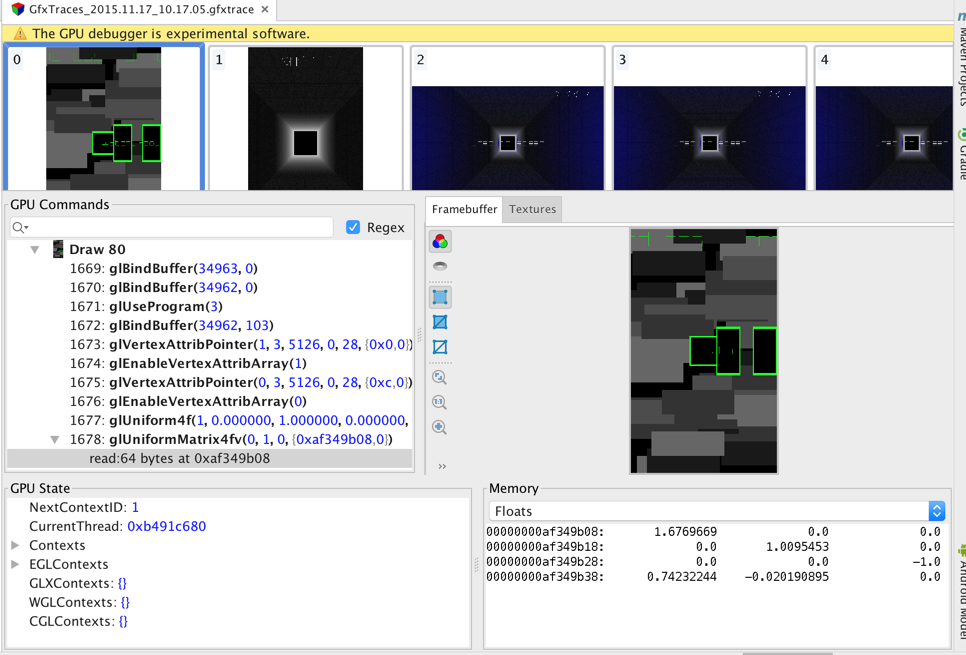
Running a traceNote that once you add the trace library, your application will block on startup until it can connect to the Android Studio trace receiver. This will render your application useless outside of debugging contexts, so be sure to remove the trace library from your application when you’re done with the profiler. To start a trace, deploy and run your app as normal. It should load with a blank screen while it waits for the trace receiver; to enable the receiver, go to the CPU/GPU tab of the Android Monitor. Click the red trace button on the left side of the GPU subtab: Once you begin tracing, your application should unblock and proceed as normal. As you interact with it, all GPU data will be captured by the trace. When you’re done capturing data, click the trace button again to stop the trace. As soon as the trace has finished being written to the file, it will be opened ready for inspection. Reading trace resultsTraces will be logged to a new captures folder inside your project. When you open a trace, the top bar of the UI will show the full sequence of logged frames. You can select an individual frame via either the top bar or the GPU commands panel; once you select a frame, the center right framebuffer window will update to show that frame’s contents. If you expand the frame on the lefthand GPU commands window, you’ll see the individual draw commands and GL calls that were used. If you click on a draw command, the framebuffer preview will be updated to reflect the contents as of that draw call. As applicable, the memory window in the lower right will also be updated to show relevant memory state at the time of the call. At any point, you can use the GPU State window or the Textures tab to explore relevant GPU state at the time of your selected frame or draw calls.
If you run into issues, please help us improve the 2.0 release by logging bugs in our public Issues Tracker. You can create an issue via this link or by clicking on Help → Submit Feedback directly in Android Studio. |